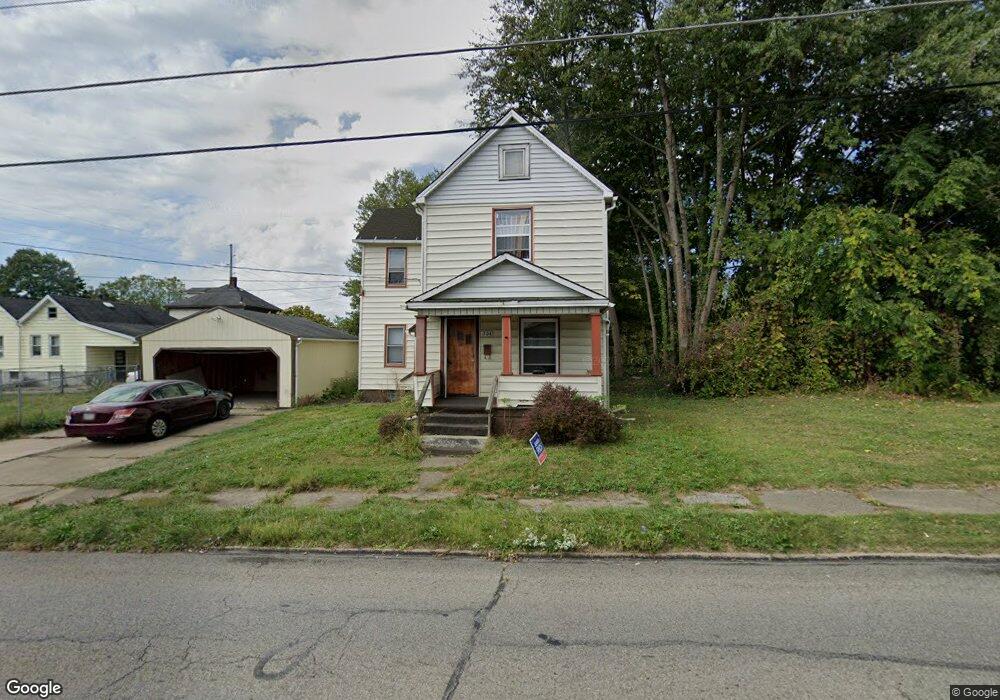
304 12th St Campbell, OH 44405
Estimated Value: $69,135 - $97,000
3
Beds
1
Bath
1,184
Sq Ft
$70/Sq Ft
Est. Value
About This Home
This home is located at 304 12th St, Campbell, OH 44405 and is currently estimated at $83,284, approximately $70 per square foot. 304 12th St is a home located in Mahoning County with nearby schools including Campbell Elementary School, Memorial High School, and Northeast Ohio Impact Academy.
Ownership History
Date
Name
Owned For
Owner Type
Purchase Details
Closed on
Oct 10, 2002
Sold by
Gary M Crim Inc
Bought by
Crim Real Estate Investment Co Ltd #1
Current Estimated Value
Purchase Details
Closed on
Apr 29, 2002
Sold by
Tsagaris Michael S and Tsagaris Tina M
Bought by
Gci Ltd Partnership I
Purchase Details
Closed on
Oct 28, 1996
Sold by
Kalouris George
Bought by
Tsagaris Michael S and Tsagaris Tina M
Purchase Details
Closed on
Apr 5, 1982
Bought by
Kalouris George and Kalouris Maria
Create a Home Valuation Report for This Property
The Home Valuation Report is an in-depth analysis detailing your home's value as well as a comparison with similar homes in the area
Home Values in the Area
Average Home Value in this Area
Purchase History
| Date | Buyer | Sale Price | Title Company |
|---|---|---|---|
| Crim Real Estate Investment Co Ltd #1 | -- | -- | |
| Gci Ltd Partnership I | $48,000 | -- | |
| Tsagaris Michael S | $20,000 | -- | |
| Kalouris George | -- | -- |
Source: Public Records
Tax History Compared to Growth
Tax History
| Year | Tax Paid | Tax Assessment Tax Assessment Total Assessment is a certain percentage of the fair market value that is determined by local assessors to be the total taxable value of land and additions on the property. | Land | Improvement |
|---|---|---|---|---|
| 2024 | $825 | $9,750 | $1,360 | $8,390 |
| 2023 | $669 | $9,750 | $1,360 | $8,390 |
| 2022 | $758 | $9,570 | $1,240 | $8,330 |
| 2021 | $570 | $9,570 | $1,240 | $8,330 |
| 2020 | $580 | $9,570 | $1,240 | $8,330 |
| 2019 | $616 | $9,030 | $1,170 | $7,860 |
| 2018 | $631 | $9,030 | $1,170 | $7,860 |
| 2017 | $642 | $9,030 | $1,170 | $7,860 |
| 2016 | $657 | $10,040 | $1,360 | $8,680 |
| 2015 | $645 | $10,040 | $1,360 | $8,680 |
| 2014 | $643 | $10,040 | $1,360 | $8,680 |
| 2013 | $630 | $10,040 | $1,360 | $8,680 |
Source: Public Records
Map
Nearby Homes