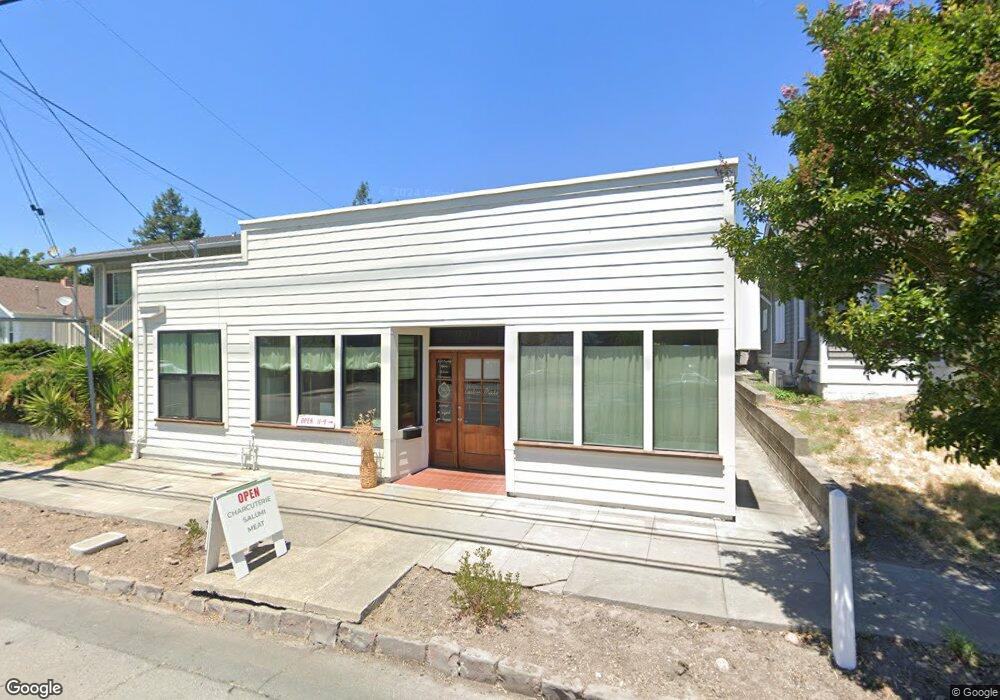
304 Bodega Ave Petaluma, CA 94952
Oakhill Brewster NeighborhoodEstimated Value: $578,182
Studio
--
Bath
1,477
Sq Ft
$391/Sq Ft
Est. Value
About This Home
This home is located at 304 Bodega Ave, Petaluma, CA 94952 and is currently estimated at $578,182, approximately $391 per square foot. 304 Bodega Ave is a home located in Sonoma County with nearby schools including Valley Vista Elementary School, Petaluma Junior High School, and Petaluma High School.
Ownership History
Date
Name
Owned For
Owner Type
Purchase Details
Closed on
Jan 13, 2015
Sold by
Eastman Raymond V and Eastman Barbara R
Bought by
Venza Dorian Anne
Current Estimated Value
Home Financials for this Owner
Home Financials are based on the most recent Mortgage that was taken out on this home.
Original Mortgage
$345,000
Outstanding Balance
$264,060
Interest Rate
3.82%
Mortgage Type
Commercial
Estimated Equity
$314,122
Purchase Details
Closed on
Feb 26, 2007
Sold by
Roche Matthew J and Steiner Robert E
Bought by
Eastman Raymond V and Eastman Barbara R
Create a Home Valuation Report for This Property
The Home Valuation Report is an in-depth analysis detailing your home's value as well as a comparison with similar homes in the area
Home Values in the Area
Average Home Value in this Area
Purchase History
| Date | Buyer | Sale Price | Title Company |
|---|---|---|---|
| Venza Dorian Anne | $369,000 | Fidelity National Title Co | |
| Eastman Raymond V | $500,000 | Fidelity National Title Co |
Source: Public Records
Mortgage History
| Date | Status | Borrower | Loan Amount |
|---|---|---|---|
| Open | Venza Dorian Anne | $345,000 |
Source: Public Records
Tax History
| Year | Tax Paid | Tax Assessment Tax Assessment Total Assessment is a certain percentage of the fair market value that is determined by local assessors to be the total taxable value of land and additions on the property. | Land | Improvement |
|---|---|---|---|---|
| 2025 | $4,894 | $443,472 | $132,199 | $311,273 |
| 2024 | $4,894 | $434,777 | $129,607 | $305,170 |
| 2023 | $4,894 | $426,253 | $127,066 | $299,187 |
| 2022 | $4,710 | $417,896 | $124,575 | $293,321 |
| 2021 | $4,623 | $409,703 | $122,133 | $287,570 |
| 2020 | $4,662 | $405,503 | $120,881 | $284,622 |
| 2019 | $4,606 | $397,553 | $118,511 | $279,042 |
| 2018 | $4,588 | $389,759 | $116,188 | $273,571 |
| 2017 | $4,494 | $382,117 | $113,910 | $268,207 |
| 2016 | $4,385 | $374,626 | $111,677 | $262,949 |
| 2015 | $4,325 | $369,000 | $110,000 | $259,000 |
| 2014 | $3,823 | $320,000 | $110,000 | $210,000 |
Source: Public Records
Map
Nearby Homes
Your Personal Tour Guide
Ask me questions while you tour the home.