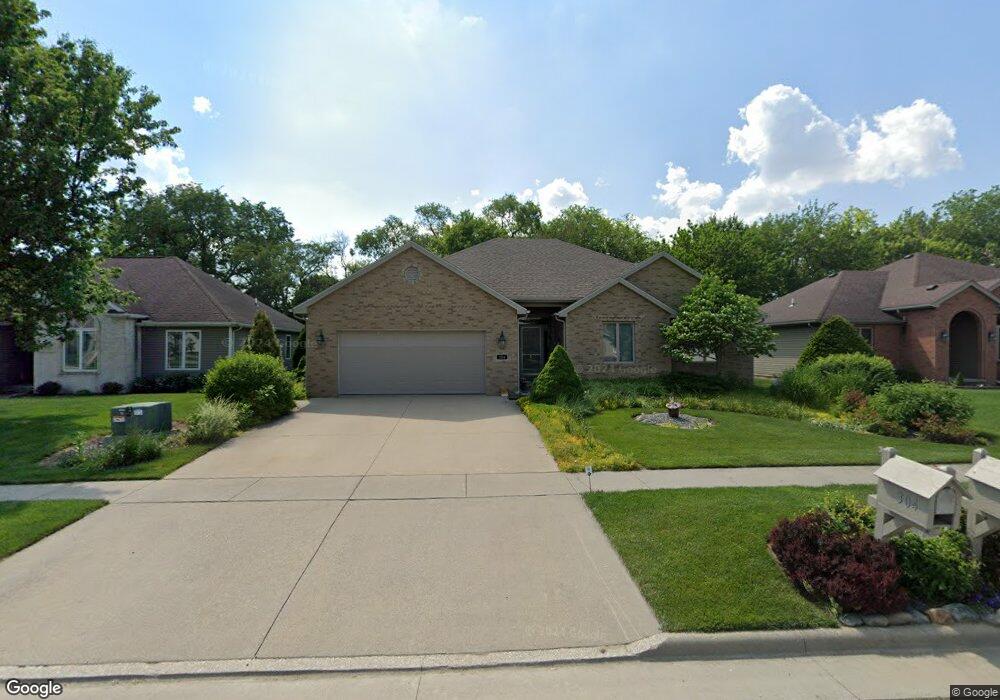
304 Buckthorn Dr Swanton, OH 43558
Estimated Value: $313,000 - $347,000
3
Beds
3
Baths
1,894
Sq Ft
$175/Sq Ft
Est. Value
About This Home
This home is located at 304 Buckthorn Dr, Swanton, OH 43558 and is currently estimated at $330,753, approximately $174 per square foot. 304 Buckthorn Dr is a home located in Fulton County with nearby schools including Swanton High School, Swanton Middle School, and St. Richard School.
Ownership History
Date
Name
Owned For
Owner Type
Purchase Details
Closed on
Oct 12, 2017
Sold by
Neifer Karen F and Neifer Don A
Bought by
Neifer Karen F
Current Estimated Value
Purchase Details
Closed on
May 31, 2005
Sold by
Rowan Dennis W and Rowan Helisa D
Bought by
Neifer Don A and Neifer Karen E
Purchase Details
Closed on
Oct 28, 2004
Sold by
Schmitz Allyn D
Bought by
Rowan Dennis W and Rowan Helisa D
Home Financials for this Owner
Home Financials are based on the most recent Mortgage that was taken out on this home.
Original Mortgage
$110,000
Interest Rate
5.85%
Mortgage Type
Purchase Money Mortgage
Purchase Details
Closed on
May 9, 2003
Sold by
Swanton Properties Llc
Bought by
Schmitz Allyn D
Create a Home Valuation Report for This Property
The Home Valuation Report is an in-depth analysis detailing your home's value as well as a comparison with similar homes in the area
Home Values in the Area
Average Home Value in this Area
Purchase History
| Date | Buyer | Sale Price | Title Company |
|---|---|---|---|
| Neifer Karen F | -- | None Available | |
| Neifer Don A | $195,500 | -- | |
| Rowan Dennis W | $195,500 | -- | |
| Schmitz Allyn D | $36,900 | Northwest Title Agency Of Oh |
Source: Public Records
Mortgage History
| Date | Status | Borrower | Loan Amount |
|---|---|---|---|
| Previous Owner | Rowan Dennis W | $110,000 |
Source: Public Records
Tax History Compared to Growth
Tax History
| Year | Tax Paid | Tax Assessment Tax Assessment Total Assessment is a certain percentage of the fair market value that is determined by local assessors to be the total taxable value of land and additions on the property. | Land | Improvement |
|---|---|---|---|---|
| 2024 | $3,250 | $90,300 | $13,510 | $76,790 |
| 2023 | $3,274 | $90,300 | $13,510 | $76,790 |
| 2022 | $2,662 | $68,150 | $11,270 | $56,880 |
| 2021 | $2,824 | $68,150 | $11,270 | $56,880 |
| 2020 | $2,864 | $68,150 | $11,270 | $56,880 |
| 2019 | $2,631 | $61,850 | $11,270 | $50,580 |
| 2018 | $2,363 | $61,850 | $11,270 | $50,580 |
| 2017 | $2,346 | $61,850 | $11,270 | $50,580 |
| 2016 | $2,222 | $51,420 | $11,270 | $40,150 |
| 2015 | $2,111 | $51,420 | $11,270 | $40,150 |
| 2014 | $2,156 | $51,420 | $11,270 | $40,150 |
| 2013 | $2,506 | $57,760 | $11,030 | $46,730 |
Source: Public Records
Map
Nearby Homes
- 7893 County Road 2
- 227 Kierra Ln
- 103 Cherry St
- 510 S Main St
- 214 Franklin Ave
- 6854 County Road 3
- 404 E Garfield Ave
- 407 E Garfield Ave
- 0 Waterwood Dr
- 433 Church St
- 204 Hickory St
- 225 Kierra Ln
- 215 Hickory St
- 6042 County Road 1-1
- 1200 County Road F
- 4303 S Berkey Southern Rd
- 4555 S Fulton Lucas Rd
- 3121 County Road Ef
- 13645 Shaffer Rd
- 2076 County Rd E
- 306 Buckthorn Dr
- 302 Buckthorn Dr
- 308 Buckthorn Dr
- 102 Crabapple Dr
- 303 Buckthorn Dr
- 301 Buckthorn Dr
- 310 Buckthorn Dr
- 104 Crabapple Dr
- 305 Buckthorn Dr
- 106 Crabapple Dr
- 94 Crabapple Dr
- 92 Crabapple Dr
- 100 Crabapple Dr
- 212 Cypress Dr
- 307 Buckthorn Dr
- 210 Cypress Dr
- 108 Crabapple Dr
- 312 Buckthorn Dr
- 208 Cypress Dr
- 204 Larch Ln