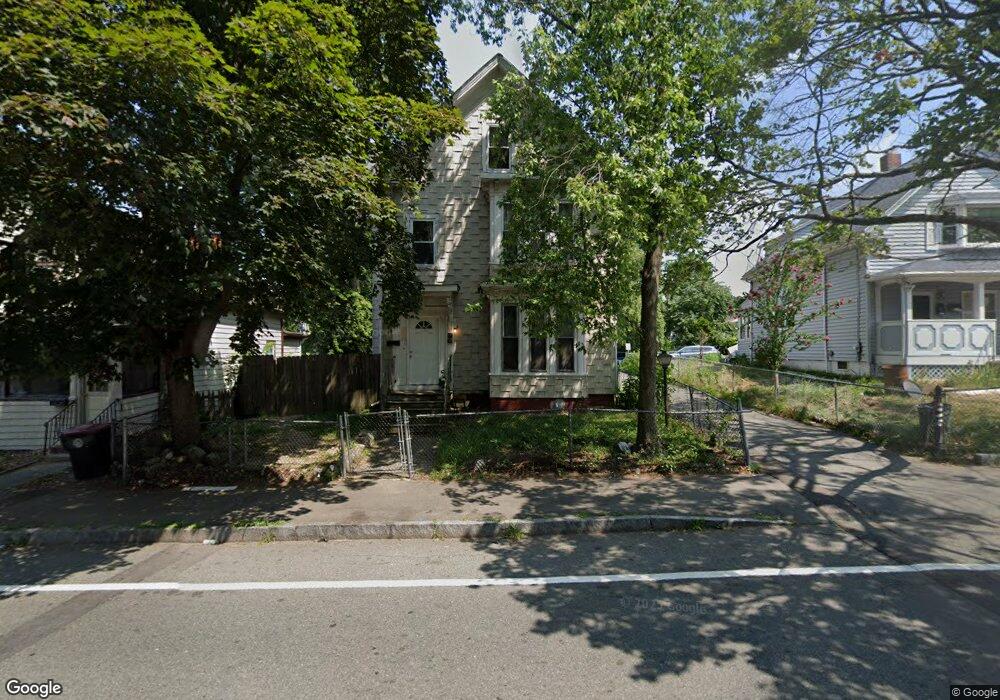
304 Centre St Brockton, MA 02302
Estimated Value: $460,000 - $541,481
5
Beds
3
Baths
2,762
Sq Ft
$183/Sq Ft
Est. Value
About This Home
This home is located at 304 Centre St, Brockton, MA 02302 and is currently estimated at $505,370, approximately $182 per square foot. 304 Centre St is a home located in Plymouth County with nearby schools including Arnone Elementary School, Joseph F. Plouffe Middle School, and Brockton Area Seventh-Day Adventist Academy.
Ownership History
Date
Name
Owned For
Owner Type
Purchase Details
Closed on
Sep 12, 2001
Sold by
Mingles Mark
Bought by
Ramos Isabel
Current Estimated Value
Home Financials for this Owner
Home Financials are based on the most recent Mortgage that was taken out on this home.
Original Mortgage
$183,549
Interest Rate
6.99%
Mortgage Type
Purchase Money Mortgage
Purchase Details
Closed on
Dec 21, 1994
Sold by
Brockton Cu
Bought by
Mingels Mark
Purchase Details
Closed on
May 10, 1994
Sold by
Clancy Paul E and Clancy Janice D
Bought by
Brockton Cu
Create a Home Valuation Report for This Property
The Home Valuation Report is an in-depth analysis detailing your home's value as well as a comparison with similar homes in the area
Purchase History
| Date | Buyer | Sale Price | Title Company |
|---|---|---|---|
| Ramos Isabel | $185,000 | -- | |
| Mingels Mark | $54,500 | -- | |
| Brockton Cu | $63,000 | -- |
Source: Public Records
Mortgage History
| Date | Status | Borrower | Loan Amount |
|---|---|---|---|
| Open | Brockton Cu | $262,000 | |
| Closed | Brockton Cu | $229,500 | |
| Closed | Brockton Cu | $183,549 | |
| Previous Owner | Brockton Cu | $60,000 |
Source: Public Records
Tax History
| Year | Tax Paid | Tax Assessment Tax Assessment Total Assessment is a certain percentage of the fair market value that is determined by local assessors to be the total taxable value of land and additions on the property. | Land | Improvement |
|---|---|---|---|---|
| 2025 | $5,130 | $423,600 | $140,100 | $283,500 |
| 2024 | $5,092 | $423,600 | $140,100 | $283,500 |
| 2023 | $5,039 | $388,200 | $104,700 | $283,500 |
| 2022 | $5,033 | $360,300 | $95,200 | $265,100 |
| 2021 | $4,991 | $344,200 | $79,100 | $265,100 |
| 2020 | $4,156 | $274,300 | $74,000 | $200,300 |
| 2019 | $3,683 | $237,000 | $72,200 | $164,800 |
| 2018 | $3,673 | $228,700 | $72,200 | $156,500 |
| 2017 | $3,930 | $244,100 | $72,200 | $171,900 |
| 2016 | $3,649 | $210,200 | $70,000 | $140,200 |
| 2015 | $3,191 | $175,790 | $70,000 | $105,790 |
| 2014 | $3,187 | $175,790 | $70,000 | $105,790 |
Source: Public Records
Map
Nearby Homes
Your Personal Tour Guide
Ask me questions while you tour the home.