Estimated Value: $152,509 - $189,000
3
Beds
2
Baths
1,152
Sq Ft
$149/Sq Ft
Est. Value
About This Home
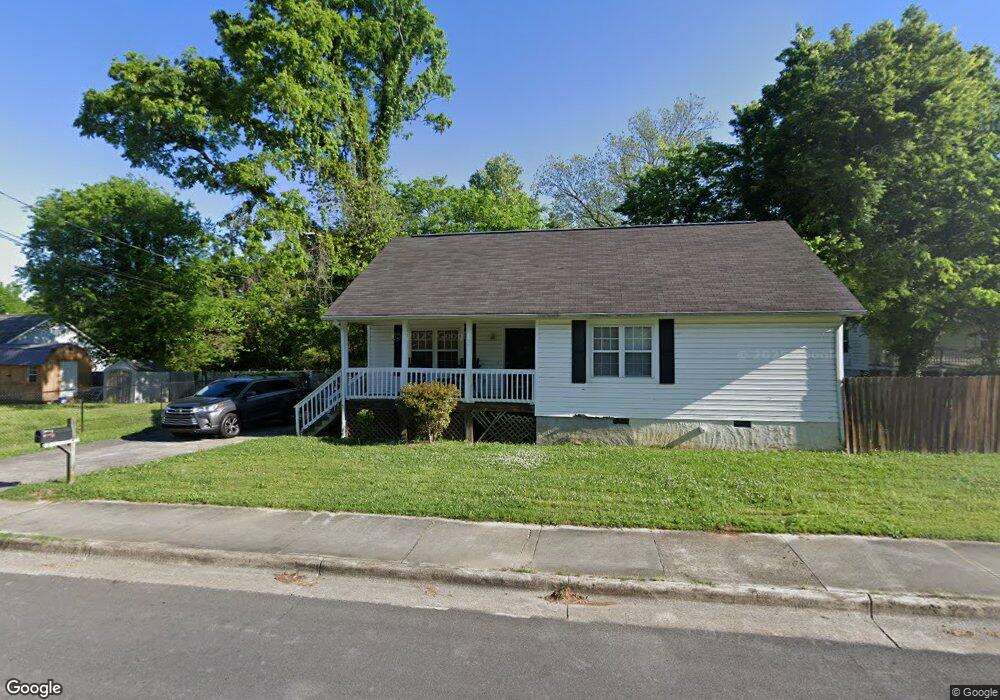
This home is located at 304 Cherokee St SW, Rome, GA 30161 and is currently estimated at $172,127, approximately $149 per square foot. 304 Cherokee St SW is a home located in Floyd County with nearby schools including Dan McCarty Middle School, Rome High School, and Darlington School.
Ownership History
Date
Name
Owned For
Owner Type
Purchase Details
Closed on
May 17, 2014
Sold by
Spears Brian C
Bought by
Spears Holdings Llc
Current Estimated Value
Purchase Details
Closed on
Mar 11, 2011
Sold by
Synovus Bank
Bought by
Spears Brian C
Purchase Details
Closed on
Sep 7, 2010
Sold by
Jester James
Bought by
Synovus Bank
Purchase Details
Closed on
Sep 3, 2002
Sold by
City Of Rome
Bought by
Jester James and Phebian Jester
Purchase Details
Closed on
Jan 28, 2000
Sold by
Braden Walter D
Bought by
City Of Rome
Purchase Details
Closed on
May 3, 1986
Sold by
Mosley Dorothy R
Bought by
Braden Walter D
Purchase Details
Closed on
Sep 17, 1984
Sold by
Wilkerson Grady
Bought by
Mosley Dorothy R
Purchase Details
Closed on
Jun 2, 1981
Sold by
Pine Log Land Co
Bought by
Wilkerson Grady
Purchase Details
Closed on
Sep 15, 1976
Sold by
Wyatt Robert G
Bought by
Pine Log Land Co
Purchase Details
Closed on
Jan 1, 1901
Bought by
Wyatt Robert G
Create a Home Valuation Report for This Property
The Home Valuation Report is an in-depth analysis detailing your home's value as well as a comparison with similar homes in the area
Home Values in the Area
Average Home Value in this Area
Purchase History
| Date | Buyer | Sale Price | Title Company |
|---|---|---|---|
| Spears Holdings Llc | -- | -- | |
| Spears Brian C | $22,500 | -- | |
| Synovus Bank | -- | -- | |
| Jester James | -- | -- | |
| City Of Rome | -- | -- | |
| Braden Walter D | -- | -- | |
| Mosley Dorothy R | -- | -- | |
| Wilkerson Grady | $22,500 | -- | |
| Pine Log Land Co | $15,000 | -- | |
| Wyatt Robert G | -- | -- |
Source: Public Records
Tax History Compared to Growth
Tax History
| Year | Tax Paid | Tax Assessment Tax Assessment Total Assessment is a certain percentage of the fair market value that is determined by local assessors to be the total taxable value of land and additions on the property. | Land | Improvement |
|---|---|---|---|---|
| 2024 | $1,678 | $43,736 | $4,542 | $39,194 |
| 2023 | $1,549 | $42,140 | $4,130 | $38,010 |
| 2022 | $1,056 | $28,927 | $3,304 | $25,623 |
| 2021 | $982 | $26,460 | $3,304 | $23,156 |
| 2020 | $921 | $24,611 | $2,581 | $22,030 |
| 2019 | $868 | $23,452 | $2,581 | $20,871 |
| 2018 | $824 | $22,258 | $2,581 | $19,677 |
| 2017 | $801 | $21,629 | $2,581 | $19,048 |
| 2016 | $789 | $21,240 | $2,560 | $18,680 |
| 2015 | $1,000 | $22,600 | $2,560 | $20,040 |
| 2014 | $1,000 | $22,600 | $2,560 | $20,040 |
Source: Public Records
Map
Nearby Homes
- 334 Branham Ave SW
- 235 Pennington Ave SW
- 110 Cherokee St SW
- 410 Hardy Ave SW
- 101 Hardy Ave SW
- 218 Wilson Ave SW
- 204 Myrtle St SW
- 105 Mary St SW
- 3 Grover St SW
- 107 Butler St SW
- 18 Butler St SW
- 232 S Broad St SW
- 515 Harper Ave SW
- 3 Porter St SW
- 529 Branham Ave SW
- 515 S Broad St SW
- 115 Lookout Cir SW
- 113 Lookout Cir SW
- 111 Lookout Cir SW
- 5 Jervis St SW
- 332 Branham Ave SW
- 400 Branham Ave SW
- 330 Branham Ave SW
- 213 Hardy Ave SW
- 211 Hardy Ave SW
- 328 Branham Ave SW
- 402 Branham Ave SW
- 209 Hardy Ave SW
- 333 Branham Ave SW
- 307 Cherokee St SW
- 326 Branham Ave SW
- 331 Branham Ave SW
- 207 Hardy Ave SW
- 406 Branham Ave SW
- 327 Branham Ave SW
- 205 Hardy Ave SW
- 324 Branham Ave SW
- 405 Branham Ave SW
- 0 Branham Ave SW Unit 7225471
- 0 Branham Ave SW Unit 8702064