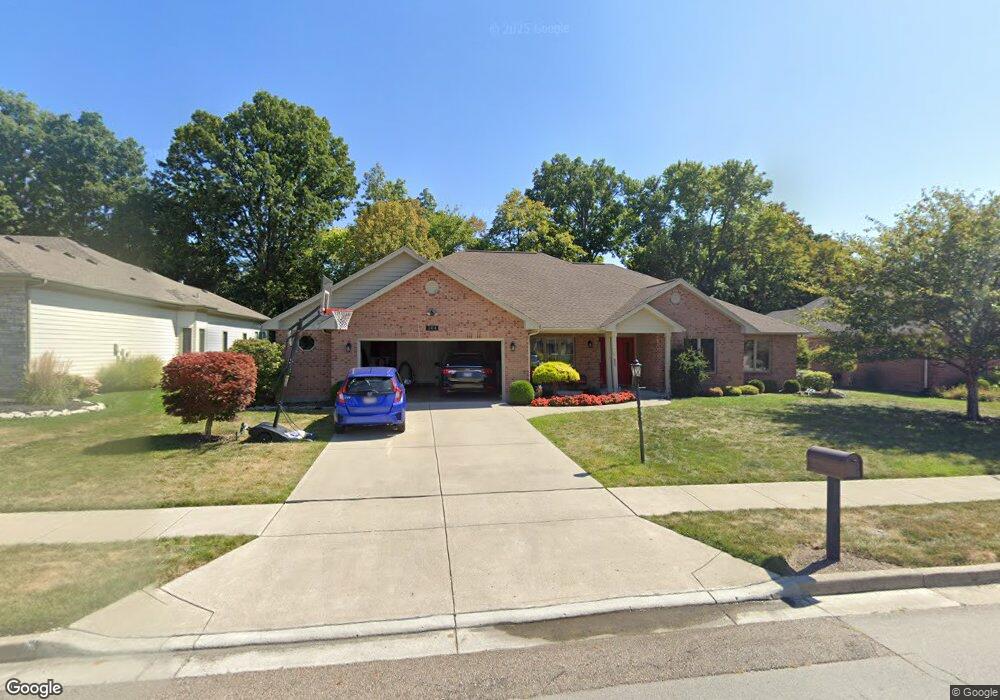
304 Chinkapin Cir Clayton, OH 45315
Estimated Value: $348,000 - $487,000
3
Beds
3
Baths
2,124
Sq Ft
$185/Sq Ft
Est. Value
About This Home
This home is located at 304 Chinkapin Cir, Clayton, OH 45315 and is currently estimated at $393,021, approximately $185 per square foot. 304 Chinkapin Cir is a home located in Montgomery County with nearby schools including Englewood Hills Elementary School, Northmont High School, and Trotwood Preparatory & Fitness Academy.
Ownership History
Date
Name
Owned For
Owner Type
Purchase Details
Closed on
Oct 1, 2013
Sold by
Fromholt John J and Fromholt Patricia A
Bought by
Keefe Jennifer M
Current Estimated Value
Home Financials for this Owner
Home Financials are based on the most recent Mortgage that was taken out on this home.
Original Mortgage
$150,000
Outstanding Balance
$113,106
Interest Rate
4.59%
Mortgage Type
Future Advance Clause Open End Mortgage
Estimated Equity
$279,915
Purchase Details
Closed on
Sep 10, 2003
Sold by
Artistic Homes Inc
Bought by
Fromholt John J and Fromholt Patricia A
Home Financials for this Owner
Home Financials are based on the most recent Mortgage that was taken out on this home.
Original Mortgage
$37,000
Interest Rate
6.18%
Mortgage Type
Purchase Money Mortgage
Purchase Details
Closed on
May 28, 2003
Sold by
Deeter Bruce and Deeter David
Bought by
G & K Investments
Create a Home Valuation Report for This Property
The Home Valuation Report is an in-depth analysis detailing your home's value as well as a comparison with similar homes in the area
Home Values in the Area
Average Home Value in this Area
Purchase History
| Date | Buyer | Sale Price | Title Company |
|---|---|---|---|
| Keefe Jennifer M | $224,000 | Rling Land Title North Llc | |
| Fromholt John J | $211,900 | Landmark Title | |
| G & K Investments | -- | Landmark Title |
Source: Public Records
Mortgage History
| Date | Status | Borrower | Loan Amount |
|---|---|---|---|
| Open | Keefe Jennifer M | $150,000 | |
| Previous Owner | Fromholt John J | $37,000 |
Source: Public Records
Tax History Compared to Growth
Tax History
| Year | Tax Paid | Tax Assessment Tax Assessment Total Assessment is a certain percentage of the fair market value that is determined by local assessors to be the total taxable value of land and additions on the property. | Land | Improvement |
|---|---|---|---|---|
| 2024 | $6,166 | $108,420 | $19,850 | $88,570 |
| 2023 | $6,166 | $108,420 | $19,850 | $88,570 |
| 2022 | $5,932 | $80,310 | $14,700 | $65,610 |
| 2021 | $5,950 | $80,310 | $14,700 | $65,610 |
| 2020 | $5,842 | $80,310 | $14,700 | $65,610 |
| 2019 | $5,768 | $71,130 | $14,700 | $56,430 |
| 2018 | $5,663 | $71,130 | $14,700 | $56,430 |
| 2017 | $5,603 | $71,130 | $14,700 | $56,430 |
| 2016 | $5,387 | $67,210 | $14,700 | $52,510 |
| 2015 | $4,922 | $67,210 | $14,700 | $52,510 |
| 2014 | $4,922 | $67,210 | $14,700 | $52,510 |
| 2012 | -- | $75,430 | $19,250 | $56,180 |
Source: Public Records
Map
Nearby Homes
- 306 Pauly Dr
- 4245 W Wenger Rd
- 108 Denwood Trail
- 900 Moonlight Dr
- 830 W Wenger Rd
- 250 Winter Creek Ct
- 881 Sunset Dr
- 1003 Sunset Dr
- 534 Unger Ave
- 206 Gardengrove Way
- 510 Rohr Ln
- 604 Heather St
- 206 Lodestone Dr
- 505 Durst Dr
- 408 W Herr St
- 510 Lambert Ln
- 109 Silverstone Dr
- 803 Albert St
- 4784 Molunat
- 4005 Clearstream Way
- 302 Chinkapin Cir
- 306 Chinkapin Cir
- 1 Deeter Dr
- 0 Deeter Unit 497405
- 0 Deeter Unit 497406
- 0 Deeter Unit 327689
- 0 Deeter Unit 327686
- 164 Deeter Dr
- 319 Shady Tree Ct
- 321 Shady Tree Ct
- 305 Chinkapin Ct
- 305 Chinkapin Cir
- 308 Chinkapin Cir
- 317 Shady Tree Ct
- 303 Chinkapin Cir
- 307 Chinkapin Cir
- 212 Denwood Trail
- 210 Denwood Trail
- 222 Denwood Trail
- 320 Shady Tree Ct