Estimated Value: $345,805 - $427,000
--
Bed
1
Bath
2,621
Sq Ft
$144/Sq Ft
Est. Value
About This Home
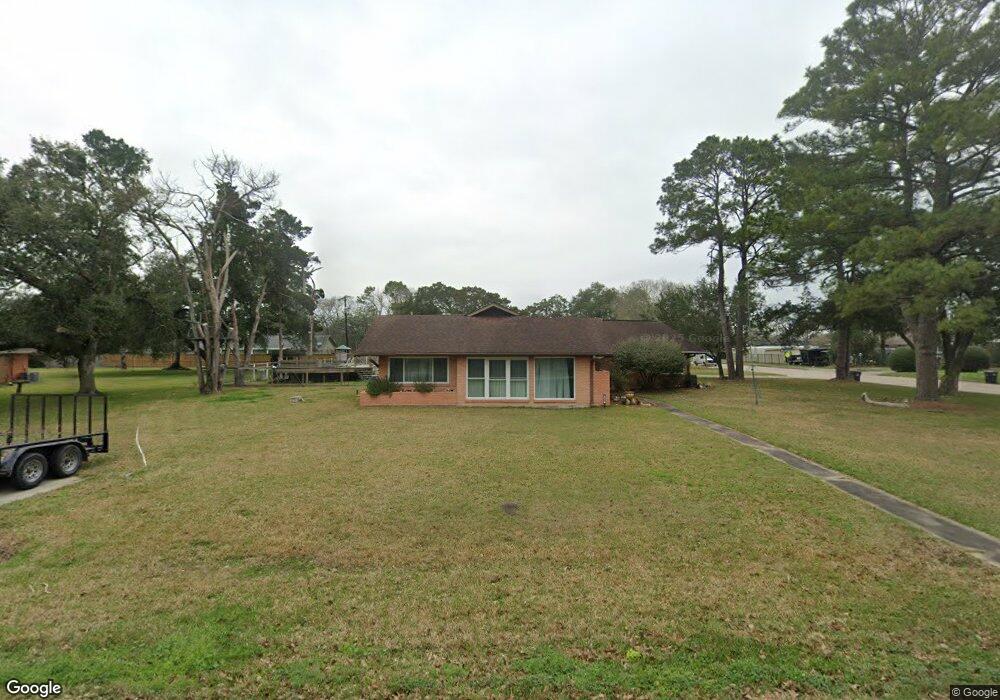
This home is located at 304 Duncan St, Alvin, TX 77511 and is currently estimated at $378,701, approximately $144 per square foot. 304 Duncan St is a home located in Brazoria County with nearby schools including Alvin Elementary School, Fairview Junior High School, and Alvin High School.
Ownership History
Date
Name
Owned For
Owner Type
Purchase Details
Closed on
Jul 28, 2015
Sold by
Glass Diana L and Hatch Donna K Kerr
Bought by
Castro Nicholas John and Castro Michelle Crystal
Current Estimated Value
Home Financials for this Owner
Home Financials are based on the most recent Mortgage that was taken out on this home.
Original Mortgage
$198,426
Outstanding Balance
$156,273
Interest Rate
4.07%
Mortgage Type
New Conventional
Estimated Equity
$222,428
Purchase Details
Closed on
Aug 5, 2004
Sold by
Dezso Elmer L and Dezso Elsie A
Bought by
Dezso Elmer L and Dezso Elsie A
Purchase Details
Closed on
Nov 20, 1995
Sold by
Deborde G L and Deborde Dott W
Bought by
Dezso Elmer and Dezso Elsie
Create a Home Valuation Report for This Property
The Home Valuation Report is an in-depth analysis detailing your home's value as well as a comparison with similar homes in the area
Home Values in the Area
Average Home Value in this Area
Purchase History
| Date | Buyer | Sale Price | Title Company |
|---|---|---|---|
| Castro Nicholas John | -- | Stewart Title Brazoria | |
| Dezso Elmer L | -- | -- | |
| Dezso Elmer | -- | -- |
Source: Public Records
Mortgage History
| Date | Status | Borrower | Loan Amount |
|---|---|---|---|
| Open | Castro Nicholas John | $198,426 |
Source: Public Records
Tax History Compared to Growth
Tax History
| Year | Tax Paid | Tax Assessment Tax Assessment Total Assessment is a certain percentage of the fair market value that is determined by local assessors to be the total taxable value of land and additions on the property. | Land | Improvement |
|---|---|---|---|---|
| 2025 | $5,718 | $338,800 | $109,380 | $245,440 |
| 2023 | $5,718 | $318,709 | $77,670 | $349,090 |
| 2022 | $7,947 | $289,735 | $77,670 | $228,230 |
| 2021 | $7,604 | $281,670 | $80,780 | $200,890 |
| 2020 | $7,008 | $239,450 | $62,140 | $177,310 |
| 2019 | $6,739 | $226,260 | $51,780 | $174,480 |
| 2018 | $6,138 | $228,730 | $62,140 | $166,590 |
| 2017 | $5,650 | $185,430 | $62,140 | $123,290 |
| 2016 | $5,630 | $184,770 | $62,140 | $122,630 |
| 2015 | $1,272 | $157,700 | $51,780 | $105,920 |
| 2014 | $1,272 | $138,440 | $51,780 | $86,660 |
Source: Public Records
Map
Nearby Homes
- 208 W Jordan St
- 225 Foster St
- 1216 S Hill St
- 1813 Meadowview Dr
- 1302 Cypress St
- 319 E South St
- 222 E Southland Ave
- 1001 Rosharon Rd
- 1020 S Booth Ln
- 1012 S Lee St
- 914 S Hill St
- 304 E Foley St
- 209 E Foley St
- 1174 Filly Creek Dr
- 313 E Dumble St
- 514 E Foley St
- 710 S Jackson St
- 1188 Filly Creek Dr
- 903 Dula St
- 00 S Highway 35 Loop