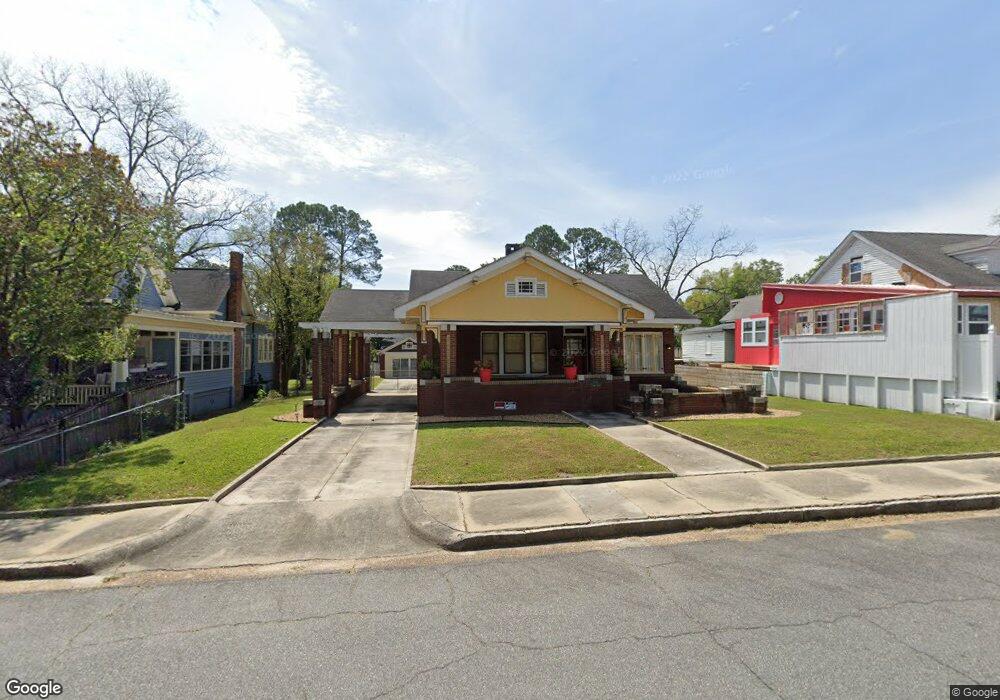
304 E 14th Ave Cordele, GA 31015
Estimated Value: $131,000 - $160,000
3
Beds
2
Baths
2,373
Sq Ft
$62/Sq Ft
Est. Value
About This Home
This home is located at 304 E 14th Ave, Cordele, GA 31015 and is currently estimated at $146,194, approximately $61 per square foot. 304 E 14th Ave is a home located in Crisp County with nearby schools including Crisp County Elementary School, Crisp County Primary School, and Crisp County Middle School.
Ownership History
Date
Name
Owned For
Owner Type
Purchase Details
Closed on
Dec 11, 2019
Sold by
Kristiansson Roth Pc
Bought by
Walker Valisha
Current Estimated Value
Home Financials for this Owner
Home Financials are based on the most recent Mortgage that was taken out on this home.
Original Mortgage
$88,271
Outstanding Balance
$59,306
Interest Rate
3.5%
Mortgage Type
FHA
Estimated Equity
$86,888
Purchase Details
Closed on
Jun 17, 2008
Sold by
Kristiansson Roth P C
Bought by
Roth Kristiansson
Purchase Details
Closed on
May 18, 2004
Sold by
Roth Robert E
Bought by
Kristiansson Roth Pc
Purchase Details
Closed on
Jul 20, 2001
Sold by
Culpepper Culpepper P and Culpepper Jane S
Bought by
Roth Robert E
Purchase Details
Closed on
Apr 2, 1979
Bought by
Culpepper Jane S
Purchase Details
Closed on
Jun 28, 1976
Bought by
Culpepper P Melton
Create a Home Valuation Report for This Property
The Home Valuation Report is an in-depth analysis detailing your home's value as well as a comparison with similar homes in the area
Purchase History
| Date | Buyer | Sale Price | Title Company |
|---|---|---|---|
| Walker Valisha | $89,900 | -- | |
| Roth Kristiansson | -- | -- | |
| Kristiansson Roth Pc | $74,900 | -- | |
| Roth Robert E | $74,900 | -- | |
| Culpepper Jane S | -- | -- | |
| Culpepper P Melton | -- | -- |
Source: Public Records
Mortgage History
| Date | Status | Borrower | Loan Amount |
|---|---|---|---|
| Open | Walker Valisha | $88,271 |
Source: Public Records
Tax History
| Year | Tax Paid | Tax Assessment Tax Assessment Total Assessment is a certain percentage of the fair market value that is determined by local assessors to be the total taxable value of land and additions on the property. | Land | Improvement |
|---|---|---|---|---|
| 2025 | $1,744 | $52,213 | $2,250 | $49,963 |
| 2024 | $1,651 | $47,452 | $2,250 | $45,202 |
| 2023 | $1,637 | $45,071 | $2,250 | $42,821 |
| 2022 | $1,076 | $42,690 | $2,250 | $40,440 |
| 2021 | $1,054 | $40,310 | $2,250 | $38,060 |
| 2020 | $956 | $40,310 | $2,250 | $38,060 |
| 2019 | $1,143 | $40,310 | $2,250 | $38,060 |
| 2018 | $966 | $32,782 | $2,250 | $30,532 |
| 2017 | $1,331 | $32,782 | $2,250 | $30,532 |
| 2016 | $969 | $32,782 | $2,250 | $30,532 |
| 2015 | -- | $32,782 | $2,250 | $30,532 |
| 2014 | -- | $32,782 | $2,250 | $30,532 |
| 2013 | -- | $32,782 | $2,250 | $30,532 |
Source: Public Records
Map
Nearby Homes
Your Personal Tour Guide
Ask me questions while you tour the home.