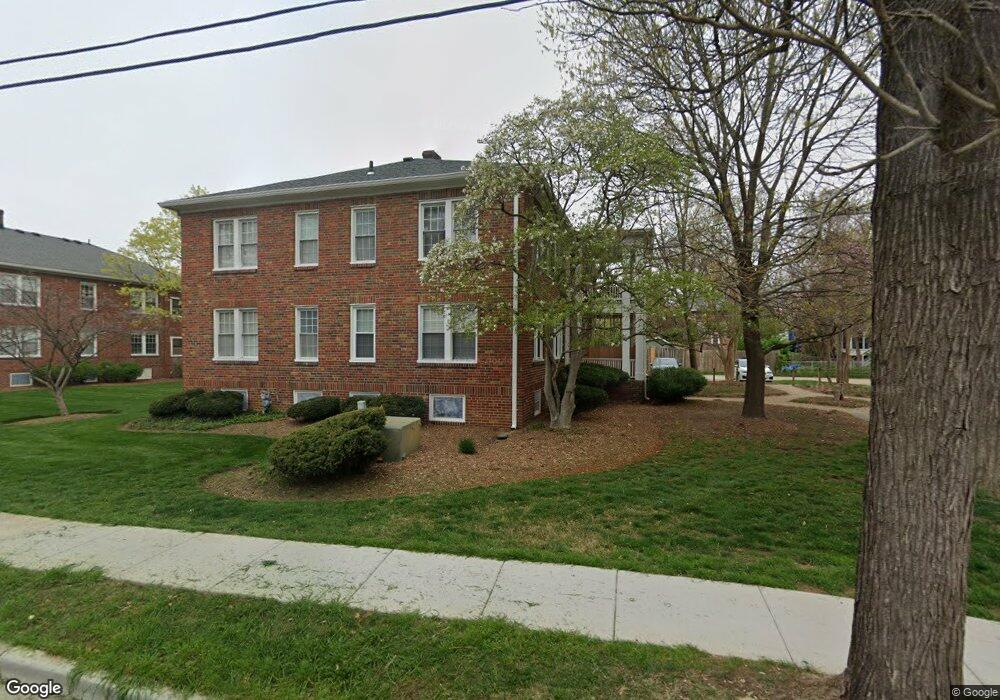
304 E Duncan Ave Alexandria, VA 22301
Del Ray NeighborhoodEstimated Value: $271,962 - $293,000
1
Bed
1
Bath
438
Sq Ft
$642/Sq Ft
Est. Value
About This Home
This home is located at 304 E Duncan Ave, Alexandria, VA 22301 and is currently estimated at $281,321, approximately $642 per square foot. 304 E Duncan Ave is a home located in Alexandria City with nearby schools including Mount Vernon Community School, George Washington Middle School, and Alexandria City High School.
Ownership History
Date
Name
Owned For
Owner Type
Purchase Details
Closed on
Feb 20, 2014
Sold by
Myers Daniel M
Bought by
Voth Timothy E
Current Estimated Value
Home Financials for this Owner
Home Financials are based on the most recent Mortgage that was taken out on this home.
Original Mortgage
$189,050
Outstanding Balance
$143,742
Interest Rate
4.5%
Mortgage Type
New Conventional
Estimated Equity
$137,579
Purchase Details
Closed on
Nov 29, 2004
Sold by
Gort Elaine L
Bought by
Myers Daniel M
Home Financials for this Owner
Home Financials are based on the most recent Mortgage that was taken out on this home.
Original Mortgage
$177,825
Interest Rate
5.75%
Mortgage Type
New Conventional
Purchase Details
Closed on
Oct 9, 2000
Sold by
Peterson Carl
Bought by
Gort Elaine L
Home Financials for this Owner
Home Financials are based on the most recent Mortgage that was taken out on this home.
Original Mortgage
$56,200
Interest Rate
7.89%
Create a Home Valuation Report for This Property
The Home Valuation Report is an in-depth analysis detailing your home's value as well as a comparison with similar homes in the area
Home Values in the Area
Average Home Value in this Area
Purchase History
| Date | Buyer | Sale Price | Title Company |
|---|---|---|---|
| Voth Timothy E | $194,900 | -- | |
| Myers Daniel M | $193,500 | -- | |
| Gort Elaine L | $57,500 | -- |
Source: Public Records
Mortgage History
| Date | Status | Borrower | Loan Amount |
|---|---|---|---|
| Open | Voth Timothy E | $189,050 | |
| Previous Owner | Myers Daniel M | $177,825 | |
| Previous Owner | Gort Elaine L | $56,200 |
Source: Public Records
Tax History Compared to Growth
Tax History
| Year | Tax Paid | Tax Assessment Tax Assessment Total Assessment is a certain percentage of the fair market value that is determined by local assessors to be the total taxable value of land and additions on the property. | Land | Improvement |
|---|---|---|---|---|
| 2025 | $3,003 | $256,748 | $80,674 | $176,074 |
| 2024 | $3,003 | $256,748 | $80,674 | $176,074 |
| 2023 | $2,850 | $256,748 | $80,674 | $176,074 |
| 2022 | $2,545 | $229,239 | $72,030 | $157,209 |
| 2021 | $2,545 | $229,239 | $72,030 | $157,209 |
| 2020 | $2,568 | $229,239 | $72,030 | $157,209 |
| 2019 | $2,467 | $218,323 | $68,600 | $149,723 |
| 2018 | $2,327 | $205,965 | $64,717 | $141,248 |
| 2017 | $2,260 | $199,966 | $62,832 | $137,134 |
| 2016 | $2,146 | $199,966 | $62,832 | $137,134 |
| 2015 | $1,986 | $190,444 | $59,840 | $130,604 |
| 2014 | $1,986 | $190,444 | $59,840 | $130,604 |
Source: Public Records
Map
Nearby Homes
- 1706 Dewitt Ave Unit A
- 1800 Mount Vernon Ave Unit 207
- 523 E Duncan Ave
- 1908 Mount Vernon Ave
- 510 E Bellefonte Ave Unit A
- 2100 Mount Vernon Ave
- 1740 Price St
- 416 E Alexandria Ave
- 304 E Nelson Ave
- 307 E Oxford Ave Unit 1/2
- 508 E Custis Ave Unit A
- 1907 Richmond Hwy Unit 101
- 24 E Bellefonte Ave
- 2007 Richmond Hwy Unit 101
- 100 E Custis Ave
- 608 E Alexandria Ave
- 1907 Main Line Blvd Unit 101
- 1901 Main Line Blvd Unit 102
- 1820 Potomac Ave
- 2215 Richmond Hwy Unit 101
- 304 E Duncan Ave Unit E
- 304 E Duncan Ave Unit G
- 304 E Duncan Ave Unit C
- 304 E Duncan Ave Unit F
- 304 E Duncan Ave Unit H
- 304 E Duncan Ave Unit B
- 304 E Duncan Ave Unit A
- 304 E Duncan Ave
- 304 E Duncan Ave Unit 304-B
- 304 E Duncan Ave Unit E
- 304 E Duncan Ave Unit 304G
- 1801 Dewitt Ave Unit E
- 1801 Dewitt Ave
- 1801 Dewitt Ave Unit B
- 1801 Dewitt Ave Unit F
- 1801 Dewitt Ave Unit H
- 1801 Dewitt Ave Unit G
- 1801 Dewitt Ave
- 1801 Dewitt Ave Unit C
- 1801 Dewitt Ave Unit A