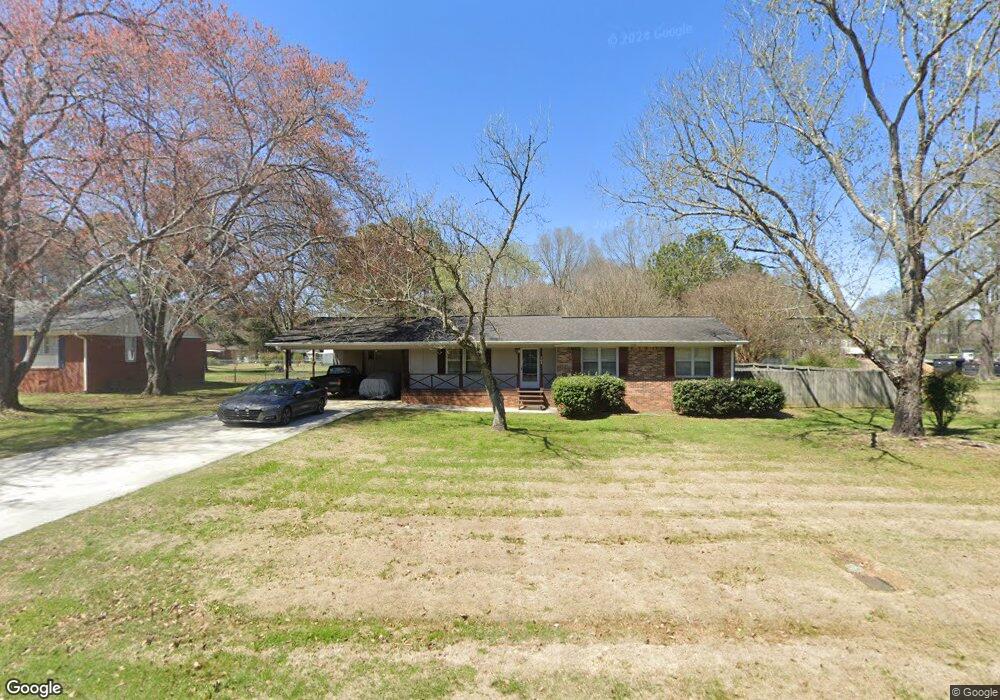
304 Greenview Ct Cedartown, GA 30125
Estimated Value: $235,000 - $263,000
3
Beds
2
Baths
1,598
Sq Ft
$154/Sq Ft
Est. Value
About This Home
This home is located at 304 Greenview Ct, Cedartown, GA 30125 and is currently estimated at $245,714, approximately $153 per square foot. 304 Greenview Ct is a home located in Polk County with nearby schools including Cedar Christian School.
Ownership History
Date
Name
Owned For
Owner Type
Purchase Details
Closed on
Jun 28, 2004
Sold by
Benton Martin Clay
Bought by
Benton Timothy James
Current Estimated Value
Purchase Details
Closed on
Aug 16, 2001
Sold by
Benton Marlin C and Linda Darlene Benton
Bought by
Benton Timothy James and Benton Marlin C
Purchase Details
Closed on
May 27, 1977
Sold by
Croker James B
Bought by
Benton Marlin C
Purchase Details
Closed on
Sep 30, 1976
Sold by
Malone Charles A
Bought by
Croker James B
Purchase Details
Closed on
Nov 21, 1972
Sold by
L & M Development Co
Bought by
Malone Charles A
Purchase Details
Closed on
Oct 2, 1972
Sold by
Leithauser Don G
Bought by
L & M Development Co
Purchase Details
Closed on
Jun 5, 1972
Sold by
Barrett Dupre and Barrett Deve
Bought by
Leithauser Don G
Purchase Details
Closed on
Aug 1, 1971
Bought by
Leithauser Don G
Create a Home Valuation Report for This Property
The Home Valuation Report is an in-depth analysis detailing your home's value as well as a comparison with similar homes in the area
Home Values in the Area
Average Home Value in this Area
Purchase History
| Date | Buyer | Sale Price | Title Company |
|---|---|---|---|
| Benton Timothy James | -- | -- | |
| Benton Timothy James | -- | -- | |
| Benton Marlin C | -- | -- | |
| Croker James B | -- | -- | |
| Malone Charles A | -- | -- | |
| L & M Development Co | -- | -- | |
| Leithauser Don G | -- | -- | |
| Barrett Dupre | -- | -- | |
| Leithauser Don G | -- | -- |
Source: Public Records
Tax History Compared to Growth
Tax History
| Year | Tax Paid | Tax Assessment Tax Assessment Total Assessment is a certain percentage of the fair market value that is determined by local assessors to be the total taxable value of land and additions on the property. | Land | Improvement |
|---|---|---|---|---|
| 2024 | $1,682 | $82,485 | $12,000 | $70,485 |
| 2023 | $1,209 | $52,962 | $8,000 | $44,962 |
| 2022 | $996 | $43,948 | $5,360 | $38,588 |
| 2021 | $1,008 | $43,948 | $5,360 | $38,588 |
| 2020 | $1,010 | $43,948 | $5,360 | $38,588 |
| 2019 | $818 | $32,458 | $4,000 | $28,458 |
| 2018 | $799 | $30,983 | $3,494 | $27,489 |
| 2017 | $789 | $30,983 | $3,494 | $27,489 |
| 2016 | $789 | $30,983 | $3,494 | $27,489 |
| 2015 | $795 | $31,127 | $3,494 | $27,633 |
| 2014 | $756 | $29,487 | $3,080 | $26,407 |
Source: Public Records
Map
Nearby Homes
- 10 Woodglen Dr
- 202 Ridgewood Rd
- 209 Ridgewood Rd
- 1101 East Ave
- 618 Valley Rd
- 645 Valley Rd
- 662 Hillside Dr
- 109 Perry St
- 660 Valley Rd
- 00 Juliette St
- 537 Fletcher St
- 77 Ben Dr W
- 427 Park St
- 254 E Girard Ave
- 292 Kimwood Dr
- 12 Breckenridge Dr
- 0 Coaling Rd Unit 9221-D 10352096
- 0 Coaling Rd Unit 9221-C 10352086
- 0 Coaling Rd Unit 9221 10352063
- 0 Coaling Rd Unit 9221-B 10352079
- 307 Greenview Ct
- 300 Greenview Ct
- 402 Greenview Ct
- 305 Greenview Ct
- 106 Rolling Hills Rd
- 401 Greenview Ct
- 303 Greenview Ct
- 406 Greenview Ct
- 301 Greenview Ct
- 104 Rolling Hills Rd
- 111 Rolling Hills Rd
- 405 Greenview Ct Unit 22
- 405 Greenview Ct
- 107 Rolling Hills Rd
- 205 Greenview Ct
- 100 Ridgewood Rd
- 105 Rolling Hills Rd
- 105 Rollinghill
- 407 Greenview Ct
- 103 Rolling Hills Rd Unit 38