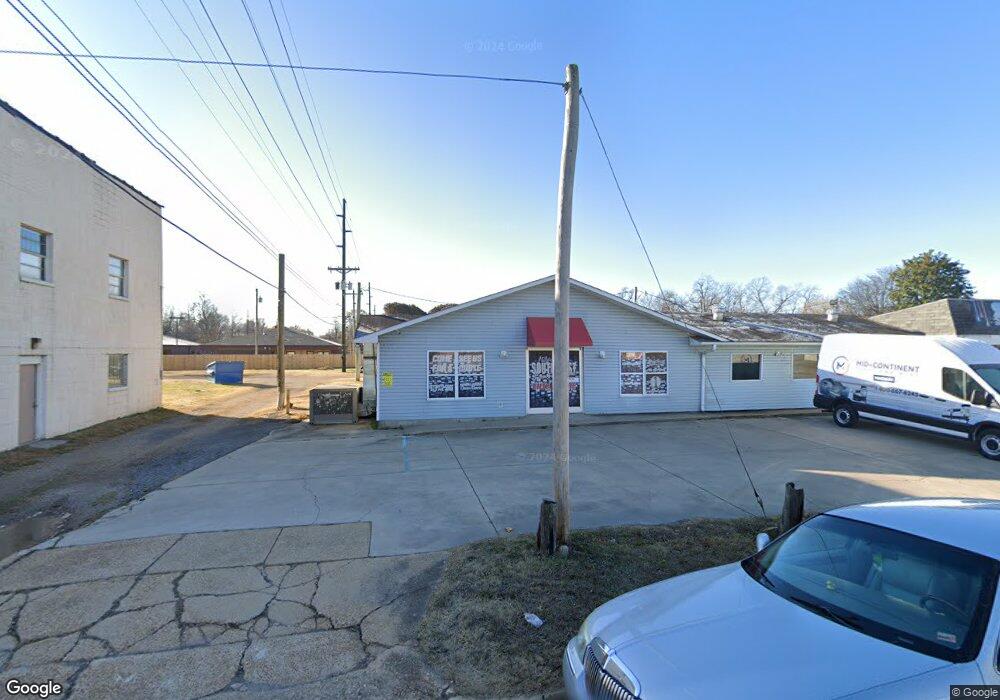
304 Hazel St Poplar Bluff, MO 63901
Estimated Value: $164,890
Studio
--
Bath
4,087
Sq Ft
$40/Sq Ft
Est. Value
About This Home
This home is located at 304 Hazel St, Poplar Bluff, MO 63901 and is currently priced at $164,890, approximately $40 per square foot. 304 Hazel St is a home located in Butler County with nearby schools including Poplar Bluff Fifth & Sixth Grade Center, Lake Road Elementary School, and Poplar Bluff Junior High School.
Ownership History
Date
Name
Owned For
Owner Type
Purchase Details
Closed on
Sep 5, 2024
Sold by
Quality Printing Co Inc
Bought by
Southeast Sign & Graphics Inc
Current Estimated Value
Home Financials for this Owner
Home Financials are based on the most recent Mortgage that was taken out on this home.
Original Mortgage
$300,000
Outstanding Balance
$296,821
Interest Rate
6.78%
Mortgage Type
New Conventional
Purchase Details
Closed on
Nov 19, 2013
Sold by
First Midwest Bank Of Poplar Bluff
Bought by
Quality Printing Co Inc
Home Financials for this Owner
Home Financials are based on the most recent Mortgage that was taken out on this home.
Original Mortgage
$66,358
Interest Rate
4.29%
Mortgage Type
Future Advance Clause Open End Mortgage
Create a Home Valuation Report for This Property
The Home Valuation Report is an in-depth analysis detailing your home's value as well as a comparison with similar homes in the area
Home Values in the Area
Average Home Value in this Area
Purchase History
| Date | Buyer | Sale Price | Title Company |
|---|---|---|---|
| Southeast Sign & Graphics Inc | -- | Heritage Title | |
| Quality Printing Co Inc | -- | None Available |
Source: Public Records
Mortgage History
| Date | Status | Borrower | Loan Amount |
|---|---|---|---|
| Open | Southeast Sign & Graphics Inc | $300,000 | |
| Previous Owner | Quality Printing Co Inc | $66,358 |
Source: Public Records
Tax History
| Year | Tax Paid | Tax Assessment Tax Assessment Total Assessment is a certain percentage of the fair market value that is determined by local assessors to be the total taxable value of land and additions on the property. | Land | Improvement |
|---|---|---|---|---|
| 2024 | $18 | $35,990 | $0 | $0 |
| 2023 | $1,825 | $35,990 | $0 | $0 |
| 2022 | $1,826 | $36,080 | $0 | $0 |
| 2021 | $1,827 | $36,080 | $0 | $0 |
| 2020 | $1,851 | $36,080 | $0 | $0 |
| 2019 | $1,849 | $36,080 | $0 | $0 |
| 2018 | $1,849 | $36,080 | $0 | $0 |
| 2017 | -- | $36,080 | $0 | $0 |
| 2016 | -- | $36,080 | $0 | $0 |
| 2015 | -- | $36,080 | $0 | $0 |
| 2014 | -- | $34,260 | $0 | $0 |
| 2012 | $1,541 | $34,260 | $0 | $0 |
Source: Public Records
Map
Nearby Homes
Your Personal Tour Guide
Ask me questions while you tour the home.