Estimated Value: $414,000 - $461,000
4
Beds
3
Baths
2,601
Sq Ft
$165/Sq Ft
Est. Value
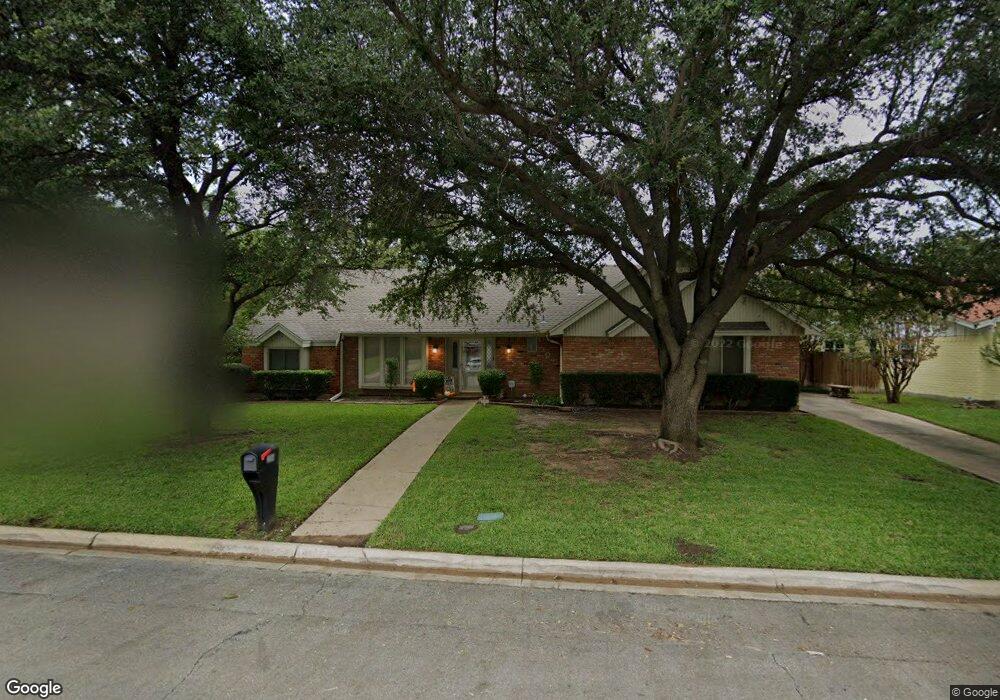
About This Home
This home is located at 304 Hillview Dr, Hurst, TX 76054 and is currently estimated at $429,445, approximately $165 per square foot. 304 Hillview Dr is a home located in Tarrant County with nearby schools including Shady Oaks Elementary School, Bedford Junior High School, and L.D. Bell High School.
Ownership History
Date
Name
Owned For
Owner Type
Purchase Details
Closed on
Mar 1, 2019
Sold by
David William A and David Sharon E
Bought by
Mcguire Donald D and Mcguire Teresa A
Current Estimated Value
Home Financials for this Owner
Home Financials are based on the most recent Mortgage that was taken out on this home.
Original Mortgage
$216,000
Outstanding Balance
$189,901
Interest Rate
4.4%
Mortgage Type
Purchase Money Mortgage
Estimated Equity
$239,544
Purchase Details
Closed on
Jan 28, 2018
Sold by
David William A
Bought by
David Sharon E
Purchase Details
Closed on
Aug 1, 2014
Sold by
Tanner Betty K
Bought by
David William A and David Sharon E
Home Financials for this Owner
Home Financials are based on the most recent Mortgage that was taken out on this home.
Original Mortgage
$211,105
Interest Rate
4.87%
Mortgage Type
FHA
Purchase Details
Closed on
Aug 1, 1993
Sold by
Tanner James A and Tanner Betty K
Bought by
Tanner James A and Tanner Betty K
Create a Home Valuation Report for This Property
The Home Valuation Report is an in-depth analysis detailing your home's value as well as a comparison with similar homes in the area
Home Values in the Area
Average Home Value in this Area
Purchase History
| Date | Buyer | Sale Price | Title Company |
|---|---|---|---|
| Mcguire Donald D | -- | Capital Title | |
| David Sharon E | -- | None Available | |
| David William A | -- | Capital Title | |
| Tanner James A | -- | -- |
Source: Public Records
Mortgage History
| Date | Status | Borrower | Loan Amount |
|---|---|---|---|
| Open | Mcguire Donald D | $216,000 | |
| Previous Owner | David William A | $211,105 |
Source: Public Records
Tax History
| Year | Tax Paid | Tax Assessment Tax Assessment Total Assessment is a certain percentage of the fair market value that is determined by local assessors to be the total taxable value of land and additions on the property. | Land | Improvement |
|---|---|---|---|---|
| 2025 | $3,582 | $376,618 | $80,000 | $296,618 |
| 2024 | $3,582 | $376,618 | $80,000 | $296,618 |
| 2023 | $7,164 | $392,839 | $55,000 | $337,839 |
| 2022 | $7,485 | $325,076 | $55,000 | $270,076 |
| 2021 | $7,165 | $298,894 | $55,000 | $243,894 |
| 2020 | $6,498 | $270,084 | $55,000 | $215,084 |
| 2019 | $6,635 | $277,781 | $55,000 | $222,781 |
| 2018 | $6,305 | $257,601 | $55,000 | $202,601 |
| 2017 | $5,855 | $231,363 | $40,000 | $191,363 |
| 2016 | $5,154 | $203,668 | $40,000 | $163,668 |
| 2015 | $2,036 | $160,300 | $17,000 | $143,300 |
| 2014 | $2,036 | $160,300 | $17,000 | $143,300 |
Source: Public Records
Map
Nearby Homes
- 201 Hillview Dr
- 201 W Louella Dr
- 440 W Louella Dr
- 413 Baker Dr
- 137 E Louella Dr
- 600 Circleview Dr N
- 1428 Pamela St
- 532 Plainview Dr
- 612 Circleview Dr S
- 412 Elisha Dr
- 180 Oakhurst Dr
- 1352 Simpson Dr
- 404 Mountainview Dr
- 1348 Norwood Dr
- 1720 Acorn Ln
- 421 Cavender Ct
- 1913 Yucca Trail
- 1740 Cynthia Ln
- 1761 Cynthia Ln
- 1756 Cynthia Ln
- 308 Hillview Dr
- 300 Hillview Dr
- 305 Circleview Dr N
- 309 Circleview Dr N
- 301 Circleview Dr N
- 305 Hillview Dr
- 312 Hillview Dr
- 309 Hillview Dr
- 301 Hillview Dr
- 313 Circleview Dr N
- 313 Hillview Dr
- 232 Hillview Dr
- 316 Hillview Dr
- 233 Circleview Dr N
- 317 Circleview Dr N
- 304 Circleview Dr S
- 304 Circleview Dr N
- 237 Hillview Dr
- 308 Circleview Dr S
- 308 Circleview Dr N
Your Personal Tour Guide
Ask me questions while you tour the home.