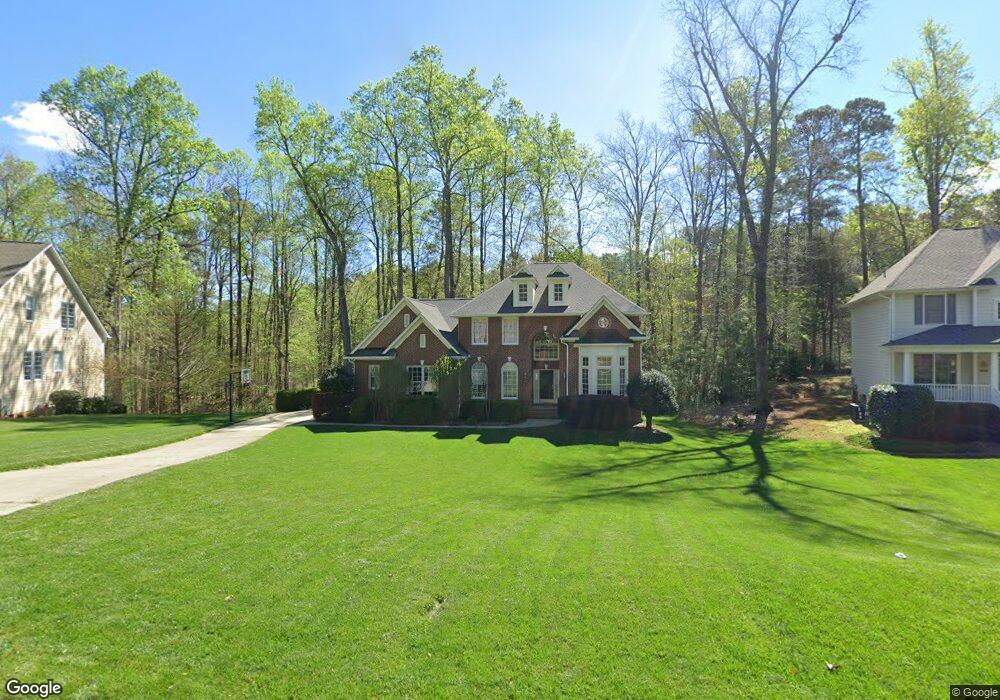
304 Hogan Woods Cir Chapel Hill, NC 27516
Estimated Value: $1,076,000 - $1,257,000
4
Beds
4
Baths
3,276
Sq Ft
$359/Sq Ft
Est. Value
About This Home
This home is located at 304 Hogan Woods Cir, Chapel Hill, NC 27516 and is currently estimated at $1,176,994, approximately $359 per square foot. 304 Hogan Woods Cir is a home located in Orange County with nearby schools including Morris Grove Elementary School, McDougle Middle School, and Chapel Hill High School.
Ownership History
Date
Name
Owned For
Owner Type
Purchase Details
Closed on
May 29, 2018
Sold by
Daly Barry and Daly Rhonda
Bought by
Reynolds Patric A and Killgrove Kristina
Current Estimated Value
Home Financials for this Owner
Home Financials are based on the most recent Mortgage that was taken out on this home.
Original Mortgage
$453,100
Outstanding Balance
$390,134
Interest Rate
4.4%
Mortgage Type
New Conventional
Estimated Equity
$786,860
Purchase Details
Closed on
May 27, 2005
Sold by
Weekley Homes Lp
Bought by
Daly Barry and Daly Rhonda
Home Financials for this Owner
Home Financials are based on the most recent Mortgage that was taken out on this home.
Original Mortgage
$359,600
Interest Rate
5.8%
Mortgage Type
Fannie Mae Freddie Mac
Purchase Details
Closed on
Jul 9, 2004
Sold by
Bolin Creek Investments Llc
Bought by
Weekley Homes Lp and D Weekley Homes Lp
Create a Home Valuation Report for This Property
The Home Valuation Report is an in-depth analysis detailing your home's value as well as a comparison with similar homes in the area
Home Values in the Area
Average Home Value in this Area
Purchase History
| Date | Buyer | Sale Price | Title Company |
|---|---|---|---|
| Reynolds Patric A | $610,000 | None Available | |
| Daly Barry | $601,500 | Bb&T | |
| Weekley Homes Lp | $421,000 | -- |
Source: Public Records
Mortgage History
| Date | Status | Borrower | Loan Amount |
|---|---|---|---|
| Open | Reynolds Patric A | $453,100 | |
| Previous Owner | Daly Barry | $359,600 | |
| Closed | Weekley Homes Lp | $0 | |
| Closed | Daly Barry | $35,000 |
Source: Public Records
Tax History Compared to Growth
Tax History
| Year | Tax Paid | Tax Assessment Tax Assessment Total Assessment is a certain percentage of the fair market value that is determined by local assessors to be the total taxable value of land and additions on the property. | Land | Improvement |
|---|---|---|---|---|
| 2025 | $15,160 | $1,104,100 | $325,000 | $779,100 |
| 2024 | $12,148 | $715,200 | $135,000 | $580,200 |
| 2023 | $11,945 | $715,200 | $135,000 | $580,200 |
| 2022 | $11,808 | $715,200 | $135,000 | $580,200 |
| 2021 | $11,719 | $715,200 | $135,000 | $580,200 |
| 2020 | $11,759 | $690,600 | $150,000 | $540,600 |
| 2018 | $10,597 | $631,000 | $150,000 | $481,000 |
| 2017 | $10,396 | $631,000 | $150,000 | $481,000 |
| 2016 | $10,396 | $613,977 | $89,499 | $524,478 |
| 2015 | $10,396 | $613,977 | $89,499 | $524,478 |
| 2014 | $10,356 | $613,977 | $89,499 | $524,478 |
Source: Public Records
Map
Nearby Homes
- 201 E Winmore Ave
- 114 Philips Square
- 214 Towne Ridge Ln
- 110 Bellamy Ln Unit 102
- 110 Bellamy Ln Unit 109
- 110 Bellamy Ln Unit 107
- 110 Bellamy Ln Unit 202
- 110 Bellamy Ln Unit 111
- 110 Bellamy Ln Unit 206
- 110 Bellamy Ln Unit 108
- 110 Bellamy Ln Unit 103
- 110 Bellamy Ln Unit 104
- Site2 @819 Homestead Rd
- 804 Long Meadows Rd
- 1717 Purefoy Dr Unit B
- 304 Homestead Rd
- 120 Stony Hill Rd
- 8780 Old Nc 86
- 205 Cobblestone Dr
- 208 Golden Gate Ln
- 302 Hogan Woods Cir
- 306 Hogan Woods Cir
- 101 Redfoot Rd
- 308 Hogan Woods Cir
- 301 Hogan Woods Cir
- 303 Hogan Woods Cir
- 310 Hogan Woods Cir
- 211 Hogan Woods Cir
- 100 Redfoot Rd
- 209 Hogan Woods Cir
- 312 Hogan Woods Cir
- 305 Hogan Woods Cir
- 204 Hogan Woods Cir
- 207 Hogan Woods Cir
- 214 Commons Way
- 212 Commons Way
- 307 Hogan Woods Cir
- 202 Hogan Woods Cir
- 100 Arbor Creek Ct
- 205 Hogan Woods Cir