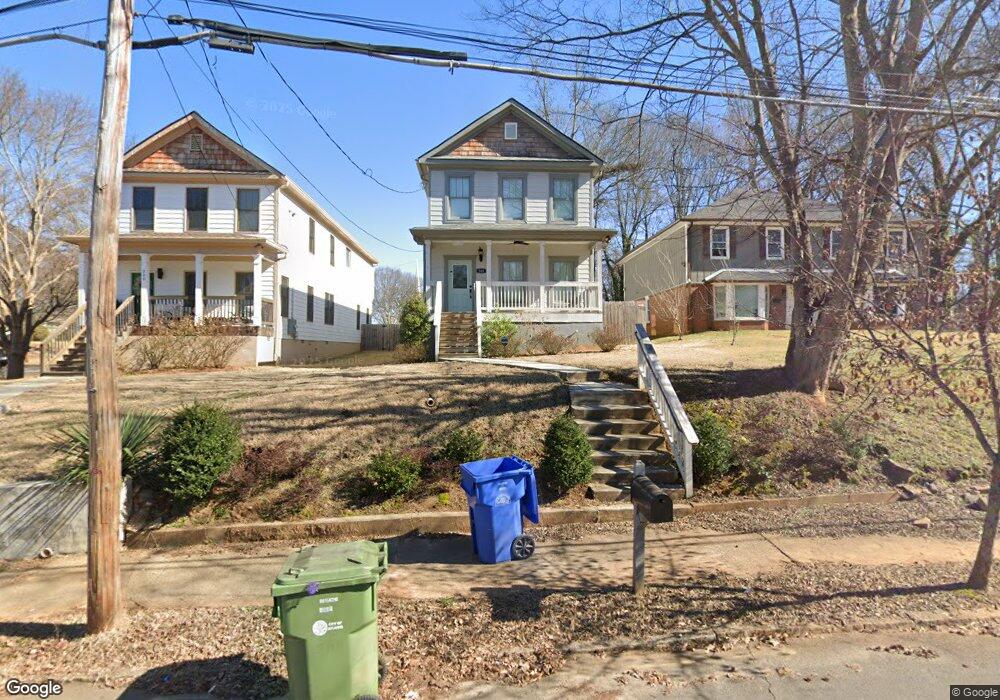
304 Holderness St SW Unit 8 Atlanta, GA 30310
West End NeighborhoodEstimated Value: $455,900 - $602,000
4
Beds
3
Baths
2,300
Sq Ft
$232/Sq Ft
Est. Value
About This Home
This home is located at 304 Holderness St SW Unit 8, Atlanta, GA 30310 and is currently estimated at $532,725, approximately $231 per square foot. 304 Holderness St SW Unit 8 is a home located in Fulton County with nearby schools including M. A. Jones Elementary School, Herman J. Russell West End Academy, and Booker T. Washington High School.
Ownership History
Date
Name
Owned For
Owner Type
Purchase Details
Closed on
Dec 23, 2020
Sold by
Republic United Propeties Llc
Bought by
Holdsworth John Paul
Current Estimated Value
Home Financials for this Owner
Home Financials are based on the most recent Mortgage that was taken out on this home.
Original Mortgage
$403,655
Outstanding Balance
$359,373
Interest Rate
2.7%
Mortgage Type
New Conventional
Estimated Equity
$173,352
Purchase Details
Closed on
Jan 30, 2019
Sold by
Hornsby Rogers
Bought by
Republic United Propeties Llc
Home Financials for this Owner
Home Financials are based on the most recent Mortgage that was taken out on this home.
Original Mortgage
$260,000
Interest Rate
4.5%
Mortgage Type
Commercial
Purchase Details
Closed on
Jul 12, 2016
Sold by
John W
Bought by
Hornsby Rogers
Create a Home Valuation Report for This Property
The Home Valuation Report is an in-depth analysis detailing your home's value as well as a comparison with similar homes in the area
Home Values in the Area
Average Home Value in this Area
Purchase History
| Date | Buyer | Sale Price | Title Company |
|---|---|---|---|
| Holdsworth John Paul | $424,900 | -- | |
| Republic United Propeties Llc | -- | -- | |
| Hornsby Rogers | $8,000 | -- |
Source: Public Records
Mortgage History
| Date | Status | Borrower | Loan Amount |
|---|---|---|---|
| Open | Holdsworth John Paul | $403,655 | |
| Previous Owner | Republic United Propeties Llc | $260,000 |
Source: Public Records
Tax History Compared to Growth
Tax History
| Year | Tax Paid | Tax Assessment Tax Assessment Total Assessment is a certain percentage of the fair market value that is determined by local assessors to be the total taxable value of land and additions on the property. | Land | Improvement |
|---|---|---|---|---|
| 2025 | $3,737 | $187,960 | $26,200 | $161,760 |
| 2023 | $7,046 | $170,200 | $50,240 | $119,960 |
| 2022 | $4,011 | $148,880 | $33,840 | $115,040 |
| 2021 | $5,005 | $123,560 | $26,720 | $96,840 |
| 2020 | $4,531 | $110,600 | $26,960 | $83,640 |
| 2019 | $482 | $94,920 | $12,560 | $82,360 |
| 2018 | $1,254 | $30,280 | $4,720 | $25,560 |
| 2017 | $136 | $3,160 | $3,160 | $0 |
| 2016 | $184 | $4,240 | $3,160 | $1,080 |
| 2015 | $639 | $4,240 | $3,160 | $1,080 |
| 2014 | $254 | $5,600 | $4,840 | $760 |
Source: Public Records
Map
Nearby Homes
- 1181 Westview Dr SW
- 253 1st St SW
- 228 Napoleon Dr SW
- 225 1st St SW
- 375 Atwood St SW
- 1150 Fair St SW
- 1159 Fair St SW
- 253 Lawton St SW
- 1152 Greenwich St SW
- 945 Fair St SW
- 450 Atwood St SW
- 1247 Lucile Ave SW
- 442 Hopkins St SW
- 0 Lucile Ave Unit 7665312
- 136 Stafford St SW
- 0 Lucile Ave SW Unit 10624252
- 167 Rockmart Dr SW
- 210 Chicamauga Ave SW
- 159 Lawton St SW
- 147 Lawton St SW
- 304 Holderness St SW
- 300 Holderness St SW
- 308 Holderness St SW
- 318 Holderness St SW
- 320 Holderness St SW
- 305 Holderness St SW
- 299 Holderness St SW
- 326 Holderness St SW
- 319 Holderness St SW Unit 319
- 319 Holderness St SW
- 319 Holderness St SW
- 315 Holderness St SW
- 330 Holderness St SW
- 1181 Westview Dr SW Unit 18
- 1201 Westview Dr SW
- 1177 Westview Dr SW
- 1207 Westview Dr SW
- 334 Holderness St SW Unit Apartment A
- 334 Holderness St SW Unit 2
- 334 Holderness St SW