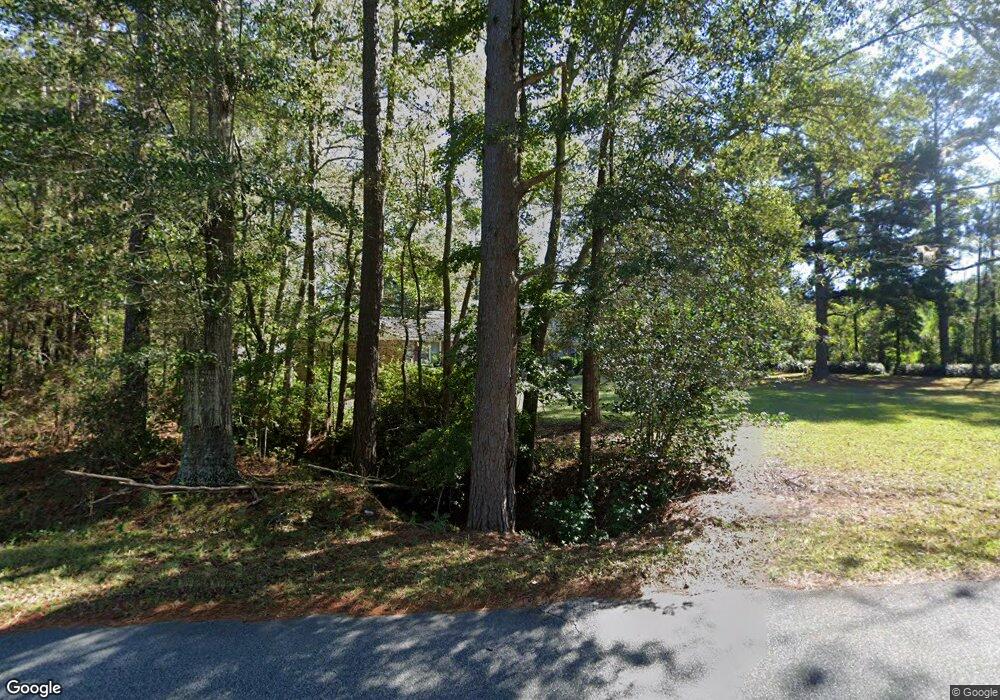
304 Hudson Rd Saint George, SC 29477
Estimated Value: $245,000 - $330,000
--
Bed
--
Bath
3,558
Sq Ft
$80/Sq Ft
Est. Value
About This Home
This home is located at 304 Hudson Rd, Saint George, SC 29477 and is currently estimated at $285,030, approximately $80 per square foot. 304 Hudson Rd is a home located in Dorchester County with nearby schools including Williams Memorial Elementary School, St. George Middle School, and Harleyville-Ridgeville Middle.
Ownership History
Date
Name
Owned For
Owner Type
Purchase Details
Closed on
Apr 19, 2017
Sold by
Limehouse Thomas A
Bought by
Felder Richard L
Current Estimated Value
Purchase Details
Closed on
Jun 30, 2016
Sold by
Mcmillian Kay Frances
Bought by
Felder Richard and Felder Priscilla
Home Financials for this Owner
Home Financials are based on the most recent Mortgage that was taken out on this home.
Original Mortgage
$117,826
Interest Rate
3.25%
Mortgage Type
FHA
Purchase Details
Closed on
Jun 22, 2016
Sold by
Mcmillan Kay Frances and Estate Of Raymond Mcmillan
Bought by
Mcmillan Kay Frances
Home Financials for this Owner
Home Financials are based on the most recent Mortgage that was taken out on this home.
Original Mortgage
$117,826
Interest Rate
3.25%
Mortgage Type
FHA
Purchase Details
Closed on
Jul 26, 2006
Sold by
Mcmillan Kay Frances
Bought by
Mcmillan Kay Frances
Create a Home Valuation Report for This Property
The Home Valuation Report is an in-depth analysis detailing your home's value as well as a comparison with similar homes in the area
Home Values in the Area
Average Home Value in this Area
Purchase History
| Date | Buyer | Sale Price | Title Company |
|---|---|---|---|
| Felder Richard L | $18,000 | None Available | |
| Felder Richard | $120,000 | None Available | |
| Mcmillan Kay Frances | -- | None Available | |
| Mcmillan Kay Frances | -- | None Available |
Source: Public Records
Mortgage History
| Date | Status | Borrower | Loan Amount |
|---|---|---|---|
| Previous Owner | Felder Richard | $117,826 |
Source: Public Records
Tax History Compared to Growth
Tax History
| Year | Tax Paid | Tax Assessment Tax Assessment Total Assessment is a certain percentage of the fair market value that is determined by local assessors to be the total taxable value of land and additions on the property. | Land | Improvement |
|---|---|---|---|---|
| 2025 | $792 | $10,618 | $1,274 | $9,344 |
| 2024 | $792 | $10,618 | $1,274 | $9,344 |
| 2023 | $792 | $5,662 | $364 | $5,298 |
| 2022 | $677 | $8,180 | $630 | $7,550 |
| 2021 | $3,199 | $8,180 | $630 | $7,550 |
| 2020 | $2,964 | $7,110 | $550 | $6,560 |
| 2019 | $2,964 | $7,110 | $550 | $6,560 |
| 2018 | $2,628 | $5,970 | $240 | $5,730 |
| 2017 | $2,620 | $5,970 | $240 | $5,730 |
| 2016 | $612 | $5,970 | $240 | $5,730 |
| 2015 | $610 | $5,970 | $240 | $5,730 |
| 2014 | $496 | $129,720 | $0 | $0 |
| 2013 | -- | $5,190 | $0 | $0 |
Source: Public Records
Map
Nearby Homes
- 335 Hudson Rd
- 00 Davis Terrace
- 01 Davis Terrace
- 678 Winningham Rd
- 686 Winningham Rd
- 515 Farmers Market Rd
- 159 Bishopville Rd
- 103 Sharon Ln
- 306 Park St
- 0 Mulberry Rd Unit 22536201
- 0 Mulberry Rd Unit 25022166
- 472 Reeves Farm Rd
- 0 Doyle St Unit 24018915
- 104 Bryant St
- 471 Reeves Farm Rd
- 461 Reeves Farm Rd
- 6156 Badham Dr
- 805 Horne St
- 0 Ordie Rd Unit 22026751
- 223 N Metts St
- 304 Hudson Rd
- 304 Hudson Rd
- 304 Hudson Rd
- 305 Hudson Rd
- 322 Hudson Rd
- 112 Riley Cir
- 301 Hudson Rd
- 118 Riley Cir
- 124 Riley Cir
- 341 Hudson Rd
- 121 Elmore Terrace
- 146 Callaway Dr
- 132 Callaway Dr
- 153 Callaway Dr
- 139 Callaway Dr
- 147 Callaway Dr
- 120 Callaway Dr
- 161 Callaway Dr
- 170 Callaway Dr
- 170 Callaway Dr