Estimated Value: $1,732,000 - $2,416,000
4
Beds
6
Baths
4,306
Sq Ft
$466/Sq Ft
Est. Value
About This Home
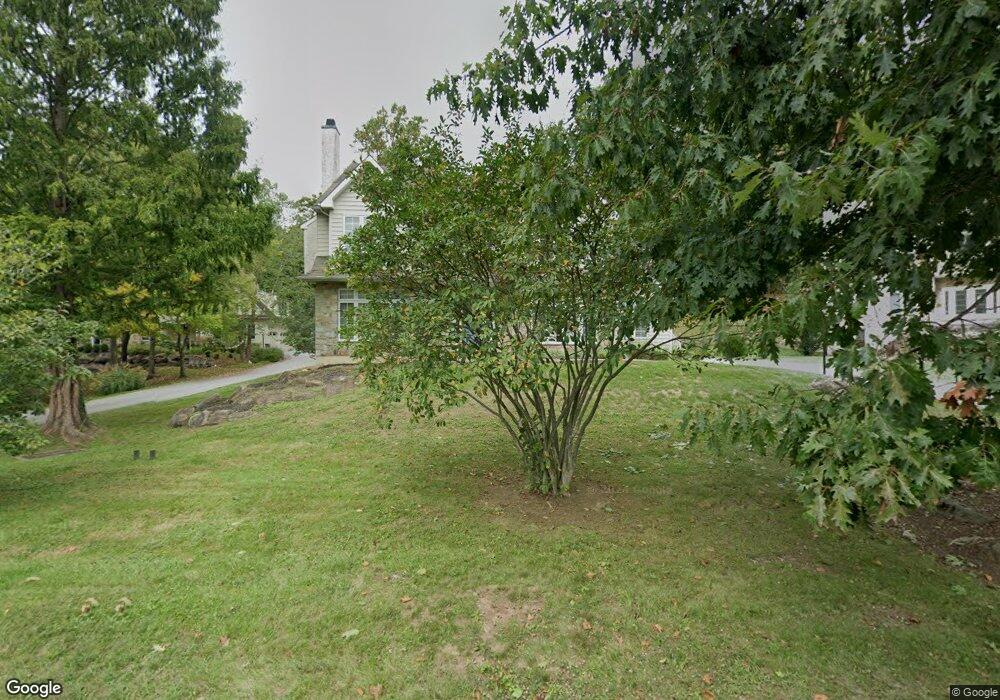
This home is located at 304 Iven Ave, Wayne, PA 19087 and is currently estimated at $2,006,773, approximately $466 per square foot. 304 Iven Ave is a home located in Delaware County with nearby schools including Wayne Elementary School, Radnor Middle School, and Radnor Senior High School.
Ownership History
Date
Name
Owned For
Owner Type
Purchase Details
Closed on
Jun 25, 2015
Sold by
Ly Luong V and Ly Jenny T
Bought by
Ly Luong and Ly Trinh C
Current Estimated Value
Purchase Details
Closed on
Jul 23, 2007
Sold by
Ly Luong V and Ly Trinh Chau
Bought by
Ly Luong and Ly Jenny T
Purchase Details
Closed on
Aug 30, 2005
Sold by
Tomson William T and Tomson Anne B
Bought by
Ly Luong and Ly Trinh Chau
Home Financials for this Owner
Home Financials are based on the most recent Mortgage that was taken out on this home.
Original Mortgage
$966,400
Outstanding Balance
$515,076
Interest Rate
5.79%
Mortgage Type
Fannie Mae Freddie Mac
Estimated Equity
$1,491,697
Purchase Details
Closed on
Oct 8, 2001
Sold by
Lanni Paul G
Bought by
Tomson William T and Tomson Anne B
Create a Home Valuation Report for This Property
The Home Valuation Report is an in-depth analysis detailing your home's value as well as a comparison with similar homes in the area
Home Values in the Area
Average Home Value in this Area
Purchase History
| Date | Buyer | Sale Price | Title Company |
|---|---|---|---|
| Ly Luong | -- | None Available | |
| Ly Luong | -- | None Available | |
| Ly Luong | $1,208,000 | Trident Land Transfer Co | |
| Tomson William T | $838,000 | -- |
Source: Public Records
Mortgage History
| Date | Status | Borrower | Loan Amount |
|---|---|---|---|
| Open | Ly Luong | $966,400 |
Source: Public Records
Tax History
| Year | Tax Paid | Tax Assessment Tax Assessment Total Assessment is a certain percentage of the fair market value that is determined by local assessors to be the total taxable value of land and additions on the property. | Land | Improvement |
|---|---|---|---|---|
| 2025 | $20,218 | $1,000,000 | $334,630 | $665,370 |
| 2024 | $20,218 | $1,000,000 | $334,630 | $665,370 |
| 2023 | $19,417 | $1,000,000 | $334,630 | $665,370 |
| 2022 | $19,205 | $1,000,000 | $334,630 | $665,370 |
| 2021 | $30,849 | $1,000,000 | $334,630 | $665,370 |
| 2020 | $24,157 | $694,410 | $169,110 | $525,300 |
| 2019 | $23,475 | $694,410 | $169,110 | $525,300 |
| 2018 | $23,015 | $694,410 | $0 | $0 |
| 2017 | $22,533 | $694,410 | $0 | $0 |
| 2016 | $3,811 | $694,410 | $0 | $0 |
| 2015 | $3,889 | $694,410 | $0 | $0 |
| 2014 | $3,889 | $694,410 | $0 | $0 |
Source: Public Records
Map
Nearby Homes
- 220 Radnor Chester Rd
- 421 Midland Ave
- 427 E Lancaster Ave Unit 1202
- 24 Orchard Ln
- 466 Saint Davids Ave
- 444 Saint Davids Ave
- 625 Conestoga Rd
- 0 Greenwell Ln
- 458 Huston Rd
- 658 Brooke Rd
- 245 Willow Ave
- 101 Highfield Rd
- 201 S Spring Mill Rd
- 541 Atterbury Rd
- 105 Privet Ln
- 317 E Beechtree Ln
- 700 Camp Woods Rd
- 1052 Eagle Rd
- 203 Church St
- 412 Fairview Dr
- 300 Iven Ave
- 284 Iven Ave Unit 2B-272-2A
- 284 Iven Ave Unit 2B-294-2A
- 284 Iven Ave Unit 2B-266-2A
- 284 Iven Ave Unit 1B-270-1C
- 284 Iven Ave Unit 1B-290-3C
- 284 Iven Ave Unit 2B-294-3A
- 284 Iven Ave Unit 2B-264-2B
- 284 Iven Ave Unit 2B-292-3B
- 284 Iven Ave Unit 2B-290-2A
- 284 Iven Ave Unit 1B-278-3D
- 284 Iven Ave Unit 1B-276-2D
- 284 Iven Ave Unit 2B-286-3A
- 284 Iven Ave Unit 1B-272-1C
- 284 Iven Ave Unit 1B-270-2C
- 284 Iven Ave Unit 2B-252-2A
- 284 Iven Ave Unit 2B-288-3A
- 284 Iven Ave Unit 1B-250-3D
- 284 Iven Ave Unit 1B-286-2C
- 284 Iven Ave Unit 1B-276-3A
Your Personal Tour Guide
Ask me questions while you tour the home.