
Seller's Agent in 2026
Karen Parris
Coldwell Banker Pryor Realty
(423) 356-1294
1 in this area
25 Total Sales

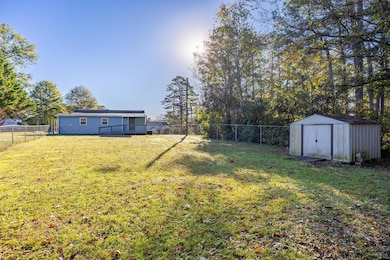
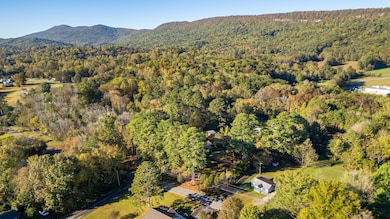
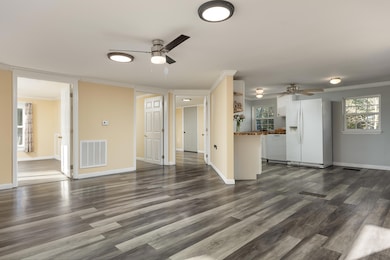
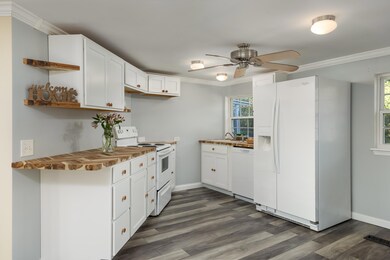
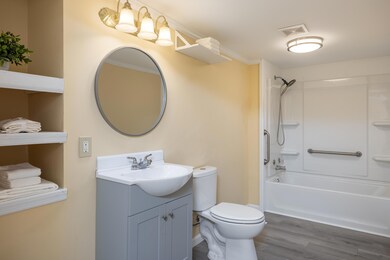
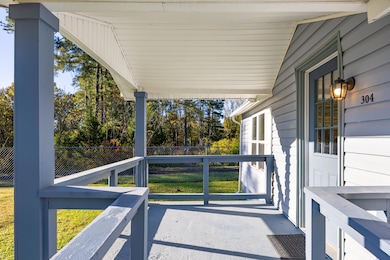
Price Improvement! Charming 2-bedroom, 1-bath cottage-style home in Flintstone, GA. This move-in ready retreat features an updated kitchen and bathroom, luxury vinyl plank flooring, and a fenced yard perfect for pets or outdoor relaxation. Enjoy a peaceful setting close to hiking trails, local parks, and all the attractions of Lookout Mountain-just minutes away. Located only 8 minutes to Chattanooga and 8 minutes to Fort Oglethorpe, GA. Enjoy the ease of one level living with no steps to climb. The HVAC is 4 years old and the exterior has updated aluminum siding. Electrical and plumbing updates have also been done. Make this cozy cottage your next home! This home may qualify for 100% financing through the GA Dream program for qualified buyers. Contact me or your favorite lender for more information.
Last Agent to Sell the Property
Coldwell Banker Pryor Realty License #316317 Listed on: 10/23/2025
| Date | Type | Sale Price | Title Company |
|---|---|---|---|
| Warranty Deed | $193,500 | -- | |
| Quit Claim Deed | -- | -- | |
| Deed | -- | -- | |
| Deed | $11,700 | -- | |
| Deed | $11,700 | -- | |
| Deed | -- | -- | |
| Deed | $20,000 | -- | |
| Deed | -- | -- | |
| Deed | -- | -- | |
| Deed | -- | -- | |
| Deed | $22,000 | -- | |
| Deed | -- | -- | |
| Deed | -- | -- |
| Date | Status | Loan Amount | Loan Type |
|---|---|---|---|
| Open | $154,800 | New Conventional |
| Date | Event | Price | List to Sale | Price per Sq Ft |
|---|---|---|---|---|
| 02/13/2026 02/13/26 | Sold | $193,500 | -2.5% | $230 / Sq Ft |
| 01/01/2026 01/01/26 | Pending | -- | -- | -- |
| 11/10/2025 11/10/25 | Price Changed | $198,500 | -2.5% | $236 / Sq Ft |
| 10/23/2025 10/23/25 | For Sale | $203,500 | -- | $242 / Sq Ft |
| Year | Tax Paid | Tax Assessment Tax Assessment Total Assessment is a certain percentage of the fair market value that is determined by local assessors to be the total taxable value of land and additions on the property. | Land | Improvement |
|---|---|---|---|---|
| 2025 | $711 | $29,966 | $2,296 | $27,670 |
| 2024 | $703 | $28,460 | $1,914 | $26,546 |
| 2023 | $684 | $26,992 | $1,914 | $25,078 |
| 2022 | $631 | $23,276 | $1,914 | $21,362 |
| 2021 | $444 | $13,784 | $1,148 | $12,636 |
| 2020 | $410 | $11,990 | $1,148 | $10,842 |
| 2019 | $416 | $11,990 | $1,148 | $10,842 |
| 2018 | $317 | $11,990 | $1,148 | $10,842 |
| 2017 | $449 | $11,990 | $1,148 | $10,842 |
| 2016 | $423 | $11,990 | $1,148 | $10,842 |
| 2015 | $403 | $10,469 | $1,372 | $9,097 |
| 2014 | $329 | $10,469 | $1,372 | $9,097 |
| 2013 | -- | $10,469 | $1,372 | $9,097 |
Seller's Agent in 2026
Karen Parris
Coldwell Banker Pryor Realty
(423) 356-1294
1 in this area
25 Total Sales
Buyer's Agent in 2026
Nathan Burns
Keller Williams Realty
(423) 664-1900
1 in this area
3 Total Sales
Source: Greater Chattanooga REALTORS®
MLS Number: 1522862
APN: 0050-058
Disclaimer: Certain information contained herein is derived from information provided by parties other than Homes.com. All information provided is deemed reliable, but is not guaranteed to be accurate and should be independently verified.
![]() IDX information is provided exclusively for consumers’ personal, noncommercial use, that it may not be used for any purpose other than to identify prospective properties consumers may be interested in purchasing.
IDX information is provided exclusively for consumers’ personal, noncommercial use, that it may not be used for any purpose other than to identify prospective properties consumers may be interested in purchasing.
Data is deemed reliable but is not guaranteed accurate by the MLS.
Ten-X does not display the entire MLS of Chattanooga, Inc. database on this website. The listings of some real estate brokerage firms have been excluded. Some or all of the listings displayed may not belong to the firm whose website is being visited
Copyright© 2026 by Chattanooga Association of REALTORS®
Ask me questions while you tour the home.