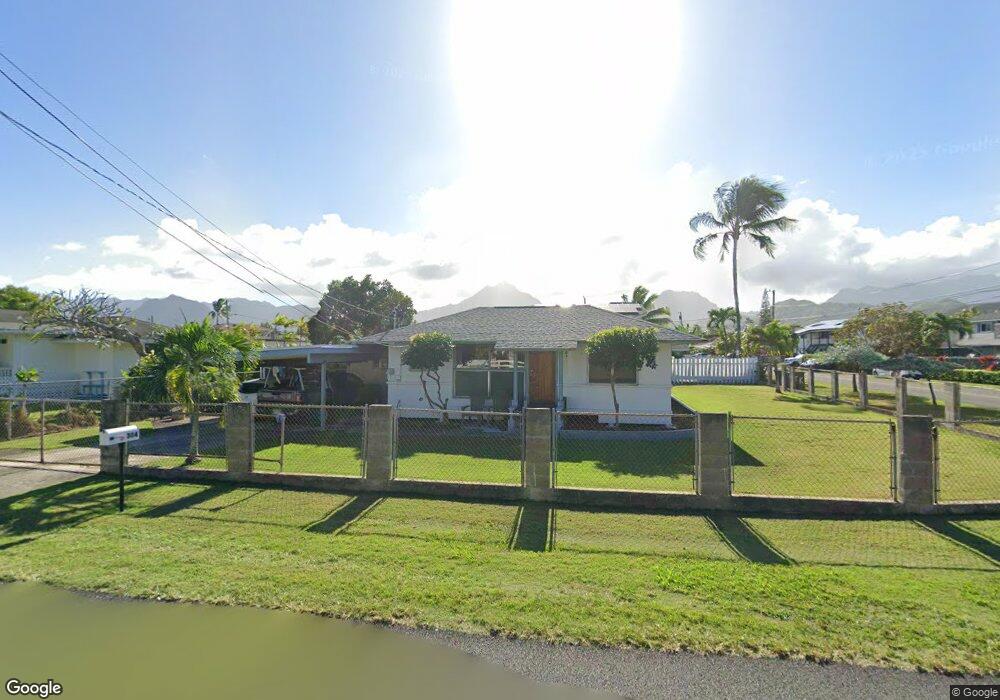
304 Kaimake Loop Kailua, HI 96734
Estimated Value: $1,521,000 - $1,841,000
3
Beds
2
Baths
1,748
Sq Ft
$958/Sq Ft
Est. Value
About This Home
This home is located at 304 Kaimake Loop, Kailua, HI 96734 and is currently estimated at $1,673,770, approximately $957 per square foot. 304 Kaimake Loop is a home located in Honolulu County with nearby schools including Kainalu Elementary School, Kailua Intermediate School, and Kalaheo High School.
Ownership History
Date
Name
Owned For
Owner Type
Purchase Details
Closed on
Jan 26, 2005
Sold by
Neil Christopher C
Bought by
Metzger Jeffrey Wayne
Current Estimated Value
Home Financials for this Owner
Home Financials are based on the most recent Mortgage that was taken out on this home.
Original Mortgage
$413,000
Outstanding Balance
$208,816
Interest Rate
5.67%
Mortgage Type
Unknown
Estimated Equity
$1,464,954
Purchase Details
Closed on
Jan 22, 2001
Sold by
Neil Christopher Charles and Neil Anne Marie Demarcken
Bought by
Neil Christopher C and Christopher C Neil Revocable Living Tr
Purchase Details
Closed on
Apr 27, 1994
Sold by
Neil Christopher Charles and Jenkins Margaret Carmody
Bought by
Neil Christopher Charles and Neil Anne Marie Demarcken
Home Financials for this Owner
Home Financials are based on the most recent Mortgage that was taken out on this home.
Original Mortgage
$280,000
Interest Rate
7.84%
Create a Home Valuation Report for This Property
The Home Valuation Report is an in-depth analysis detailing your home's value as well as a comparison with similar homes in the area
Home Values in the Area
Average Home Value in this Area
Purchase History
| Date | Buyer | Sale Price | Title Company |
|---|---|---|---|
| Metzger Jeffrey Wayne | $655,000 | -- | |
| Neil Christopher C | -- | -- | |
| Neil Christopher Charles | -- | -- |
Source: Public Records
Mortgage History
| Date | Status | Borrower | Loan Amount |
|---|---|---|---|
| Open | Metzger Jeffrey Wayne | $413,000 | |
| Previous Owner | Neil Christopher Charles | $280,000 |
Source: Public Records
Tax History
| Year | Tax Paid | Tax Assessment Tax Assessment Total Assessment is a certain percentage of the fair market value that is determined by local assessors to be the total taxable value of land and additions on the property. | Land | Improvement |
|---|---|---|---|---|
| 2025 | $4,783 | $1,669,100 | $1,484,200 | $184,900 |
| 2024 | $1,598 | $1,526,600 | $1,484,200 | $42,400 |
| 2023 | $4,579 | $1,548,300 | $1,367,000 | $181,300 |
| 2022 | $4,095 | $1,310,100 | $1,242,000 | $68,100 |
| 2021 | $3,548 | $1,153,800 | $995,300 | $158,500 |
| 2020 | $2,043 | $1,176,800 | $1,013,400 | $163,400 |
| 2019 | $3,171 | $1,026,100 | $979,900 | $46,200 |
| 2018 | $3,044 | $989,800 | $979,900 | $9,900 |
| 2017 | $2,904 | $949,800 | $842,100 | $107,700 |
| 2016 | $2,708 | $893,600 | $788,500 | $105,100 |
Source: Public Records
Map
Nearby Homes
- 661 N Kainalu Dr
- 837 Oneawa St
- 839 Oneawa St
- 1142 Mokapu Blvd
- 531 Kaiemi St
- 1251 Kainui Dr
- 1110 Ilikala Place
- 821 Kainui Dr
- 536 Olomana St
- 338 Manono St Unit B
- 609 Olomana St
- 572 C N Kalaheo Ave
- 49 Pilipu Place
- 32 Pilipu Place Unit A
- 508 N Kalaheo Ave
- 635 Olomana St
- 824 N Kalaheo Ave Unit A
- 631 Punaa St Unit A
- 396 Dune Cir
- 451 Lanae Way
- 312 Kaimake Loop
- 415 Kaha St Unit 415
- 820 Kaha Place
- 818 Kaha Place
- 305 Kaimake Loop
- 580 Kaimake Loop
- 810 Kaha Place
- 410 Kaha St
- 410 Kaha St Unit MAIN
- 320 Kaimake Loop
- 579 Kaimake Loop
- 315 Kaimake Loop
- 416 Kaha St
- 390 Kaha St
- 429 Kaha St
- 363 Kaha St
- 363 Kaha St Unit A
- 373 Kaha St
- 424 Kaha St
- 328 Kaimake Loop
Your Personal Tour Guide
Ask me questions while you tour the home.