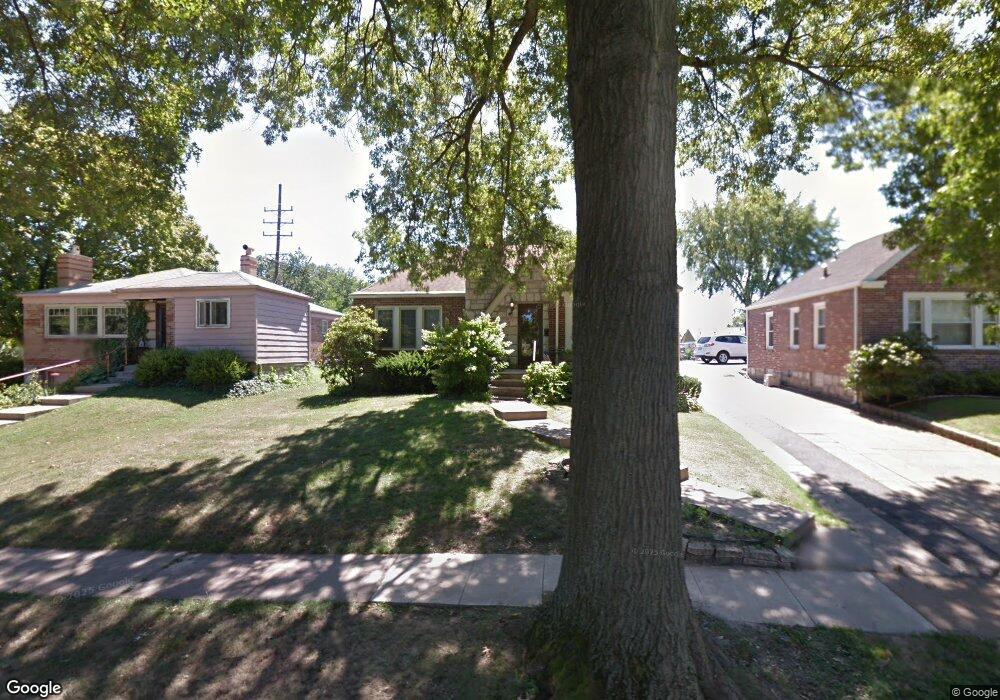
304 Landor Ct Saint Louis, MO 63125
Lemay NeighborhoodEstimated Value: $171,049 - $218,000
2
Beds
1
Bath
1,268
Sq Ft
$157/Sq Ft
Est. Value
About This Home
This home is located at 304 Landor Ct, Saint Louis, MO 63125 and is currently estimated at $198,762, approximately $156 per square foot. 304 Landor Ct is a home located in St. Louis County with nearby schools including Hancock Place Elementary School, Hancock Place Middle School, and Hancock Place High School.
Ownership History
Date
Name
Owned For
Owner Type
Purchase Details
Closed on
Sep 27, 2019
Sold by
Mayer Pamella J and Lemay Pamella J
Bought by
Dolde Jennifer M
Current Estimated Value
Home Financials for this Owner
Home Financials are based on the most recent Mortgage that was taken out on this home.
Original Mortgage
$95,000
Outstanding Balance
$62,840
Interest Rate
3.5%
Mortgage Type
New Conventional
Estimated Equity
$135,922
Purchase Details
Closed on
Jul 29, 2011
Sold by
Mayer Pamella J and Mayer Richard J
Bought by
Mayer Pamella J
Home Financials for this Owner
Home Financials are based on the most recent Mortgage that was taken out on this home.
Original Mortgage
$96,750
Interest Rate
4.52%
Mortgage Type
New Conventional
Purchase Details
Closed on
Sep 18, 2006
Sold by
Bonasch Elizabeth A
Bought by
Mayer Pamella J
Purchase Details
Closed on
Mar 31, 2004
Sold by
Sullentrop Lana B
Bought by
Bonasch Elizabeth A
Create a Home Valuation Report for This Property
The Home Valuation Report is an in-depth analysis detailing your home's value as well as a comparison with similar homes in the area
Home Values in the Area
Average Home Value in this Area
Purchase History
| Date | Buyer | Sale Price | Title Company |
|---|---|---|---|
| Dolde Jennifer M | $144,900 | True Title Company Llc | |
| Mayer Pamella J | -- | At | |
| Mayer Pamella J | $141,085 | None Available | |
| Bonasch Elizabeth A | $136,500 | -- |
Source: Public Records
Mortgage History
| Date | Status | Borrower | Loan Amount |
|---|---|---|---|
| Open | Dolde Jennifer M | $95,000 | |
| Previous Owner | Mayer Pamella J | $96,750 |
Source: Public Records
Tax History Compared to Growth
Tax History
| Year | Tax Paid | Tax Assessment Tax Assessment Total Assessment is a certain percentage of the fair market value that is determined by local assessors to be the total taxable value of land and additions on the property. | Land | Improvement |
|---|---|---|---|---|
| 2025 | $2,312 | $35,780 | $12,980 | $22,800 |
| 2024 | $2,312 | $29,570 | $5,190 | $24,380 |
| 2023 | $2,197 | $29,570 | $5,190 | $24,380 |
| 2022 | $2,269 | $27,710 | $5,990 | $21,720 |
| 2021 | $2,230 | $27,710 | $5,990 | $21,720 |
| 2020 | $2,043 | $24,200 | $5,850 | $18,350 |
| 2019 | $2,037 | $24,200 | $5,850 | $18,350 |
| 2018 | $1,647 | $16,970 | $4,520 | $12,450 |
| 2017 | $1,619 | $16,970 | $4,520 | $12,450 |
| 2016 | $1,752 | $17,740 | $3,190 | $14,550 |
| 2015 | $1,743 | $17,740 | $3,190 | $14,550 |
| 2014 | $1,733 | $18,750 | $5,530 | $13,220 |
Source: Public Records
Map
Nearby Homes
- 514 E Dallas Ct
- 622 Kayser Ave
- 712 Pardella Ave
- 8626 Shoss Ave
- 610 Kayser Ave
- 252 Wachtel Ave
- 711 Erskine Ave
- 241 Dammert Ave
- 715 Erskine Ave
- 765 Pardella Ave Unit A
- 8439 Tennessee Ave
- 235 Military Rd
- 720 Erskine Ave
- 8523 Idaho Ave
- 300 Kayser Ave
- 302 Waller Ave
- 335 Horn Ave
- 3708 Comstock Dr
- 3720 Comstock Dr
- 522 Lagro Ave