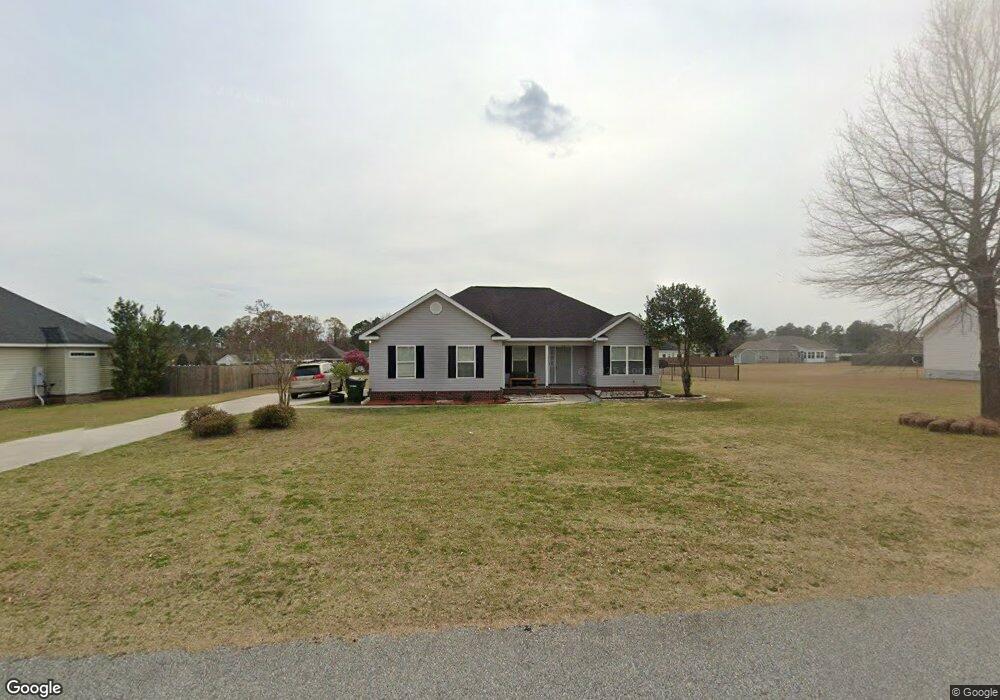
304 Leyland Rd Unit 75 Statesboro, GA 30458
Estimated Value: $260,443 - $276,000
3
Beds
2
Baths
1,354
Sq Ft
$196/Sq Ft
Est. Value
About This Home
This home is located at 304 Leyland Rd Unit 75, Statesboro, GA 30458 and is currently estimated at $264,861, approximately $195 per square foot. 304 Leyland Rd Unit 75 is a home located in Bulloch County with nearby schools including Langston Chapel Elementary School, Statesboro High School, and Langston Chapel Middle School.
Ownership History
Date
Name
Owned For
Owner Type
Purchase Details
Closed on
Aug 20, 2021
Sold by
Kendrick Samuel D
Bought by
Buford Lorie Denise
Current Estimated Value
Home Financials for this Owner
Home Financials are based on the most recent Mortgage that was taken out on this home.
Original Mortgage
$166,666
Outstanding Balance
$150,756
Interest Rate
2.7%
Mortgage Type
New Conventional
Estimated Equity
$114,105
Purchase Details
Closed on
Jul 19, 2019
Sold by
Vansant Jesse A
Bought by
Kendrick Samuel D
Home Financials for this Owner
Home Financials are based on the most recent Mortgage that was taken out on this home.
Original Mortgage
$144,640
Interest Rate
3.8%
Mortgage Type
New Conventional
Purchase Details
Closed on
Jul 27, 2007
Sold by
Not Provided
Bought by
Vansant Jesse A and Vansant Stephanie L
Home Financials for this Owner
Home Financials are based on the most recent Mortgage that was taken out on this home.
Original Mortgage
$116,700
Interest Rate
6.63%
Mortgage Type
New Conventional
Purchase Details
Closed on
Oct 26, 2006
Sold by
Not Provided
Bought by
Vansant Jesse A and Vansant Stephanie L
Create a Home Valuation Report for This Property
The Home Valuation Report is an in-depth analysis detailing your home's value as well as a comparison with similar homes in the area
Home Values in the Area
Average Home Value in this Area
Purchase History
| Date | Buyer | Sale Price | Title Company |
|---|---|---|---|
| Buford Lorie Denise | $165,000 | -- | |
| Kendrick Samuel D | $139,000 | -- | |
| Vansant Jesse A | $145,900 | -- | |
| Vansant Jesse A | $110,000 | -- |
Source: Public Records
Mortgage History
| Date | Status | Borrower | Loan Amount |
|---|---|---|---|
| Open | Buford Lorie Denise | $166,666 | |
| Previous Owner | Kendrick Samuel D | $144,640 | |
| Previous Owner | Vansant Jesse A | $116,700 | |
| Previous Owner | Vansant Jesse A | $14,590 |
Source: Public Records
Tax History Compared to Growth
Tax History
| Year | Tax Paid | Tax Assessment Tax Assessment Total Assessment is a certain percentage of the fair market value that is determined by local assessors to be the total taxable value of land and additions on the property. | Land | Improvement |
|---|---|---|---|---|
| 2024 | $2,025 | $92,120 | $20,000 | $72,120 |
| 2023 | $1,899 | $81,040 | $14,000 | $67,040 |
| 2022 | $1,399 | $67,016 | $10,240 | $56,776 |
| 2021 | $1,279 | $57,036 | $10,240 | $46,796 |
| 2020 | $1,219 | $54,042 | $10,240 | $43,802 |
| 2019 | $1,207 | $53,242 | $10,240 | $43,002 |
| 2018 | $1,232 | $52,293 | $10,120 | $42,173 |
| 2017 | $1,204 | $50,546 | $10,120 | $40,426 |
| 2016 | $1,200 | $49,198 | $10,120 | $39,078 |
| 2015 | $1,189 | $48,572 | $10,120 | $38,452 |
| 2014 | $1,100 | $48,572 | $10,120 | $38,452 |
Source: Public Records
Map
Nearby Homes
- 258 Stonebrook Way
- 412 Mayberry Way
- 310 Barney Run Unit 173
- 512 Colquitt Ln
- 206 Aunt Bee Blvd
- 208 Aunt Bee Blvd
- 202 Aunt Bee Blvd
- 171 Stonebrook Way
- 205 Sawtooth Ct
- 310 Parkersburg Ln Unit 50
- 208 Hopecrest Rd Unit 63
- 209 Hopecrest Rd
- 210 Hopecrest Rd Unit 62
- 208 Hopecrest Rd
- 210 Hopecrest Rd
- 149 Griffith Ln
- 126 Enclave Ct Unit LOT 19
- 122 Enclave Ct Unit LOT 20
- 118 Enclave Ct Unit LOT 21
- 112 Enclave Ct Unit LOT 24
- 304 Leyland Rd
- 306 Leyland Rd Unit 74
- 306 Leyland Rd
- 302 Leyland Rd
- 205 Canterberry Place
- 205 Canterberry Place Unit 53
- 203 Canterberry Place
- 207 Canterberry Place
- 308 Leyland Rd Unit 73
- 0 Leyland Rd Unit LOT 88 2749453
- 0 Leyland Rd Unit LOT 87 2749450
- 0 Leyland Rd Unit LOT 84 2749445
- 0 Leyland Rd Unit LOT 79 2749442
- 0 Leyland Rd Unit LOT 74 2749418
- 0 Leyland Rd Unit LOT 73 2749412
- 300 Leyland Rd
- 305 Leyland Rd
- 303 Leyland Rd
- 307 Leyland Rd
- 209 Canterberry Place