Estimated Value: $141,000 - $173,000
--
Bed
--
Bath
1,572
Sq Ft
$102/Sq Ft
Est. Value
About This Home
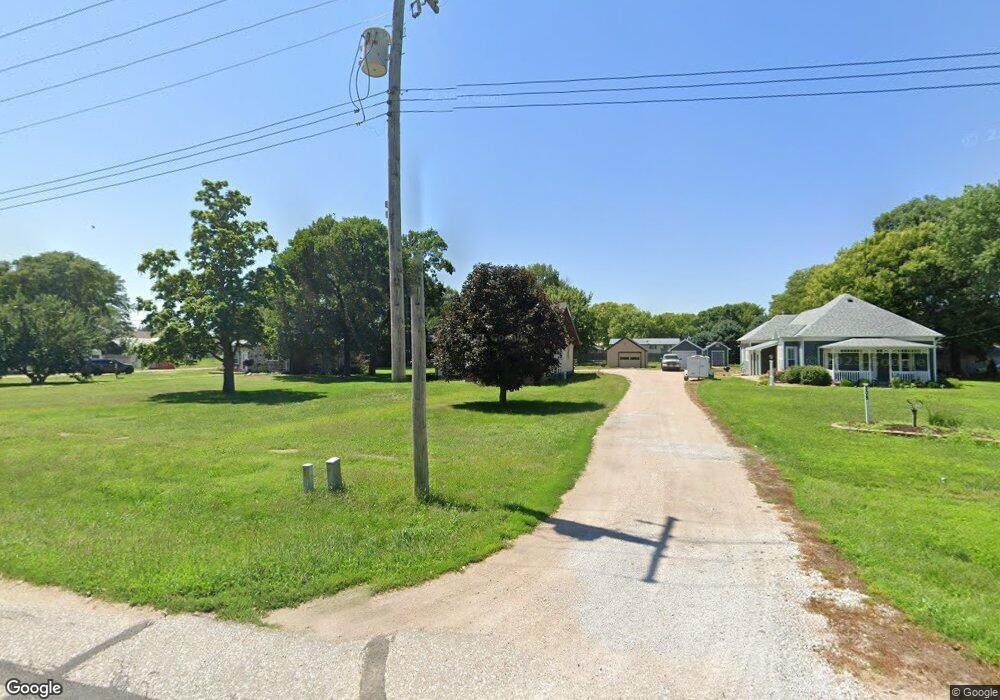
This home is located at 304 Main St, Funk, NE 68940 and is currently estimated at $161,076, approximately $102 per square foot. 304 Main St is a home with nearby schools including Holdrege Elementary School, Holdrege Middle School, and Holdrege High School.
Ownership History
Date
Name
Owned For
Owner Type
Purchase Details
Closed on
Sep 30, 2020
Sold by
Wells Blake R and Wells Katherine R
Bought by
Yung Brenton
Current Estimated Value
Home Financials for this Owner
Home Financials are based on the most recent Mortgage that was taken out on this home.
Original Mortgage
$92,150
Outstanding Balance
$81,963
Interest Rate
2.9%
Mortgage Type
New Conventional
Estimated Equity
$79,113
Purchase Details
Closed on
Apr 11, 2011
Sold by
Cole Norma J
Bought by
Bye Anthony C
Home Financials for this Owner
Home Financials are based on the most recent Mortgage that was taken out on this home.
Original Mortgage
$40,935
Interest Rate
5.5%
Mortgage Type
FHA
Create a Home Valuation Report for This Property
The Home Valuation Report is an in-depth analysis detailing your home's value as well as a comparison with similar homes in the area
Home Values in the Area
Average Home Value in this Area
Purchase History
| Date | Buyer | Sale Price | Title Company |
|---|---|---|---|
| Yung Brenton | $97,000 | Phelps County Title Company | |
| Bye Anthony C | $42,000 | -- |
Source: Public Records
Mortgage History
| Date | Status | Borrower | Loan Amount |
|---|---|---|---|
| Open | Yung Brenton | $92,150 | |
| Previous Owner | Bye Anthony C | $40,935 |
Source: Public Records
Tax History Compared to Growth
Tax History
| Year | Tax Paid | Tax Assessment Tax Assessment Total Assessment is a certain percentage of the fair market value that is determined by local assessors to be the total taxable value of land and additions on the property. | Land | Improvement |
|---|---|---|---|---|
| 2024 | $764 | $79,479 | $9,454 | $70,025 |
| 2023 | $988 | $77,297 | $7,272 | $70,025 |
| 2022 | $1,029 | $77,297 | $7,272 | $70,025 |
| 2021 | $714 | $55,757 | $7,272 | $48,485 |
| 2020 | $690 | $55,757 | $7,272 | $48,485 |
| 2019 | $577 | $49,912 | $7,272 | $42,640 |
| 2018 | $527 | $49,912 | $7,272 | $42,640 |
| 2017 | $477 | $44,930 | $4,945 | $39,985 |
| 2016 | $476 | $39,650 | $4,945 | $34,705 |
| 2015 | $441 | $39,650 | $4,945 | $34,705 |
| 2014 | $742 | $41,845 | $4,945 | $36,900 |
| 2013 | $742 | $41,845 | $4,945 | $36,900 |
Source: Public Records
Map
Nearby Homes
- 1406 Pamela Ave
- 1326 10th Ave
- 419 Sherman St
- 516 Logan St
- 816 Garfield St
- 809 A Ave
- 402 2nd Ave
- 117 W 3rd Ave
- Lots 5-7 Block 3 Craneview Third S Road Awarii Dunes
- L1B2 Craneview 3rd Subdivison
- 11491 729 Rd
- 11 Quail Run
- L4B3 Quail Run Unit L4 B3 Awarii Dunes
- L3B3 Quail Run Unit L3 B3 Awarii Dunes
- L2B3 Quail Run Unit L2 B3 Awarii Dunes
- Odess Unit a NE 68861
- 309 Oak St
- 506 W Rd
- 545 Webster St
- 550 S Blaine Ave