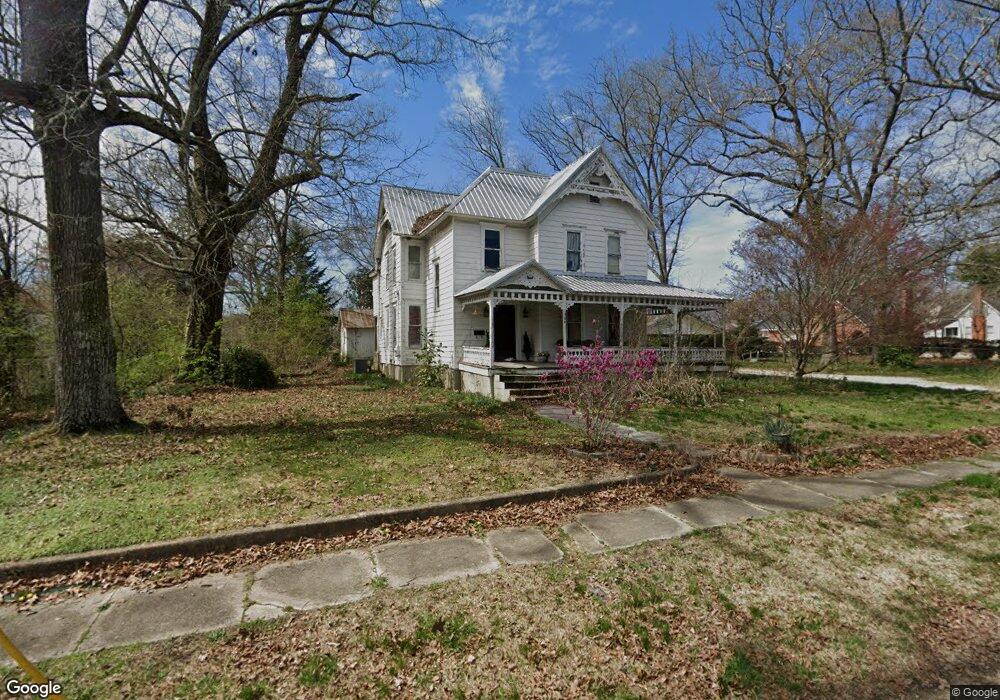
304 Manning St Tallapoosa, GA 30176
Estimated Value: $250,161 - $369,000
4
Beds
2
Baths
2,705
Sq Ft
$113/Sq Ft
Est. Value
About This Home
This home is located at 304 Manning St, Tallapoosa, GA 30176 and is currently estimated at $306,540, approximately $113 per square foot. 304 Manning St is a home located in Haralson County with nearby schools including Haralson County High School.
Ownership History
Date
Name
Owned For
Owner Type
Purchase Details
Closed on
Oct 21, 2009
Sold by
Sunrich Julianna S
Bought by
Sunrich Julianna S and Sunrich Matthew S
Current Estimated Value
Purchase Details
Closed on
Apr 17, 2009
Sold by
Bank Of North Georgia
Bought by
Sunrich Julianna S
Home Financials for this Owner
Home Financials are based on the most recent Mortgage that was taken out on this home.
Original Mortgage
$143,265
Interest Rate
5.01%
Mortgage Type
New Conventional
Purchase Details
Closed on
Mar 3, 2009
Sold by
Moon Dallas E and Tonya King
Bought by
Bank Of North Georgia
Home Financials for this Owner
Home Financials are based on the most recent Mortgage that was taken out on this home.
Original Mortgage
$143,265
Interest Rate
5.01%
Mortgage Type
New Conventional
Purchase Details
Closed on
Nov 13, 1997
Sold by
Hutcheson Charles E
Bought by
Moon Ii Dallas E and Moon Tonya
Purchase Details
Closed on
Jun 2, 1994
Bought by
Hutcheson Charles E
Purchase Details
Closed on
Jan 22, 1993
Bought by
Hutcheson
Purchase Details
Closed on
Jan 1, 1990
Bought by
Hutcheson Charles
Create a Home Valuation Report for This Property
The Home Valuation Report is an in-depth analysis detailing your home's value as well as a comparison with similar homes in the area
Home Values in the Area
Average Home Value in this Area
Purchase History
| Date | Buyer | Sale Price | Title Company |
|---|---|---|---|
| Sunrich Julianna S | -- | -- | |
| Sunrich Julianna S | $134,000 | -- | |
| Bank Of North Georgia | -- | -- | |
| Moon Ii Dallas E | $69,500 | -- | |
| Hutcheson Charles E | -- | -- | |
| Hutcheson | -- | -- | |
| Hutcheson Charles | -- | -- |
Source: Public Records
Mortgage History
| Date | Status | Borrower | Loan Amount |
|---|---|---|---|
| Previous Owner | Sunrich Julianna S | $143,265 |
Source: Public Records
Tax History Compared to Growth
Tax History
| Year | Tax Paid | Tax Assessment Tax Assessment Total Assessment is a certain percentage of the fair market value that is determined by local assessors to be the total taxable value of land and additions on the property. | Land | Improvement |
|---|---|---|---|---|
| 2024 | $1,585 | $50,303 | $7,632 | $42,671 |
| 2023 | $1,872 | $57,210 | $7,000 | $50,210 |
| 2022 | $1,194 | $46,270 | $7,000 | $39,270 |
| 2021 | $1,198 | $44,453 | $7,000 | $37,453 |
| 2020 | $1,232 | $45,534 | $7,000 | $38,534 |
| 2019 | $1,262 | $44,979 | $7,000 | $37,979 |
| 2018 | $1,277 | $44,979 | $7,000 | $37,979 |
| 2017 | $1,381 | $44,359 | $7,000 | $37,359 |
| 2016 | $1,288 | $44,209 | $7,000 | $37,209 |
| 2015 | $1,269 | $43,307 | $7,000 | $36,307 |
| 2014 | $1,327 | $43,983 | $7,676 | $36,307 |
Source: Public Records
Map
Nearby Homes
- 250 Kiker St
- 244 Monroe St
- 438 Bowdon St
- 281 Alewine Ave
- 0 W Mill St Unit 10604030
- 0 W Mill St Unit 7649366
- 0 Georgia 120 Unit 7646686
- 0 Georgia 120 Unit 10600882
- 0 Broad St Unit 10614514
- 0 Broad St Unit 10614479
- 117 White St
- 2633 Georgia 120 (485 53 Acres)
- 4493 Stone Mountain St
- 622 Cedartown Ave
- 267 Williams St
- 75 Rose St
- 0 Providence Lake Rd Unit 10576961
- 164 Berlin St
- 711 Kay St
- 20 S Kelley St