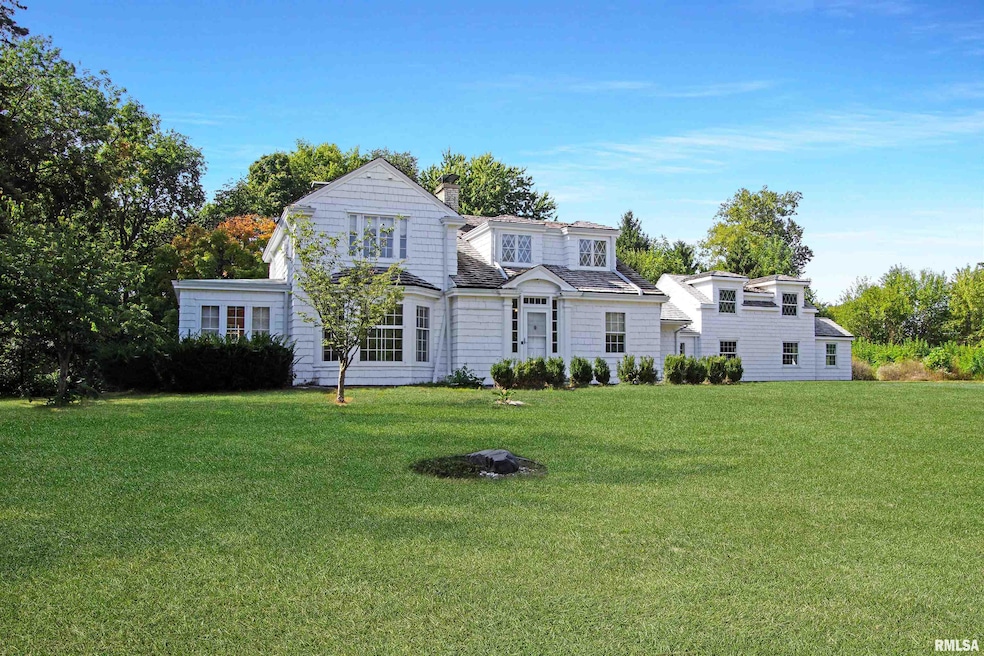
304 N Locust St Delavan, IL 61734
Estimated payment $2,690/month
Highlights
- Fireplace in Primary Bedroom
- Corner Lot
- No HOA
- Vaulted Ceiling
- Solid Surface Countertops
- Breakfast Area or Nook
About This Home
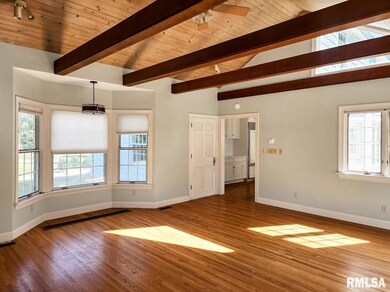
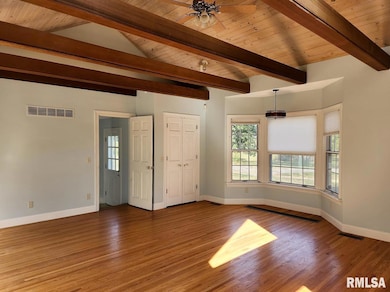
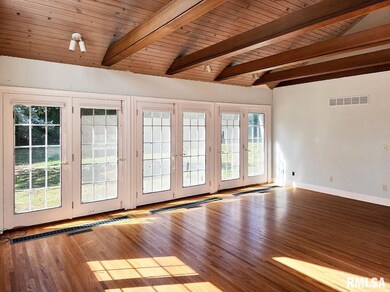
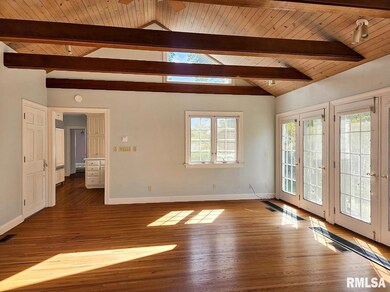
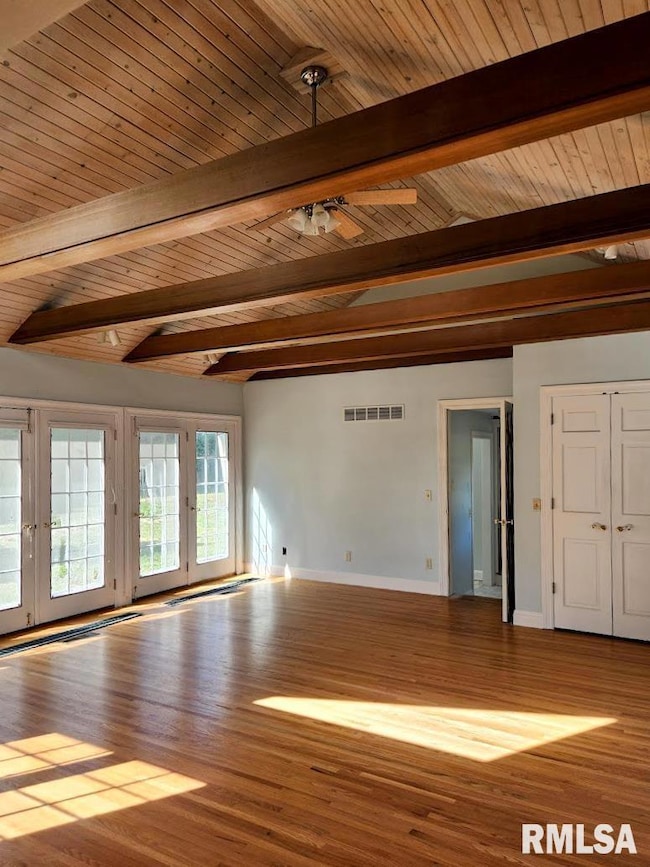
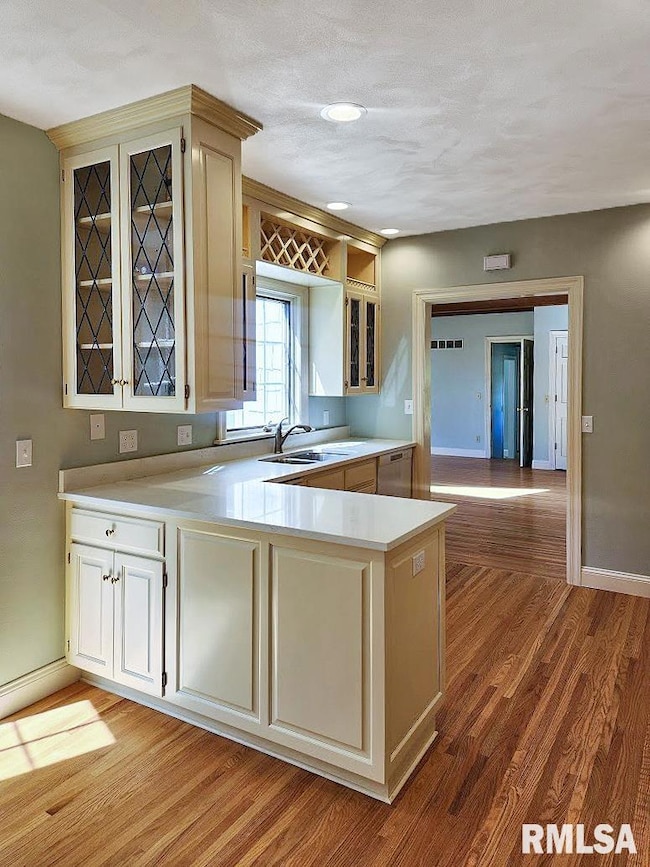
Character and comfort blend beautifully in this spacious home situated on 2.5 acres at the edge of town. Thoughtfully updated, this property offers the perfect combination of timeless charm and modern convenience. Step through the welcoming foyer where you’ll find an oversized living room w/ fireplace and built-in bookshelves, a sun-filled library/office, and a bright sunroom that flows seamlessly into the living space. The remodeled kitchen features new cabinetry, marble countertops, and a stylish backsplash, along with a cozy breakfast nook. A dining area with built-in cabinetry has functionality and elegance. Hardwood floors, fresh paint, and charming windows add character.The main floor family room impresses with its vaulted ceiling, French doors, and modern flair. The main floor laundry facilities. Upstairs, you’ll find three generous bedrooms with shared bathrooms to accommodate everyone. A recent addition expands the home with three versatile bonus rooms—perfect for an office, fitness room, hobby space, or even an extra bedroom (without closet). The upper level offers even more possibilities as a rec room, bedroom, or private suite. With quality insulation and soundproofing, this space is ideal for flexible living arrangements. The basement provides extra usable space for storage and hobbies. Outside, the 2.5-acre setting delivers privacy, space, and a true connection to the outdoors—whether you’re relaxing, entertaining, or enjoying the peaceful surroundings.
Listing Agent
RE/MAX Traders Unlimited Brokerage Phone: 309-645-3561 License #475.129457 Listed on: 10/01/2025

Home Details
Home Type
- Single Family
Est. Annual Taxes
- $9,510
Year Built
- Built in 1938
Lot Details
- 2.5 Acre Lot
- Lot Dimensions are 370x346x369x298
- Corner Lot
Parking
- Guest Parking
Home Design
- Block Foundation
- Shake Roof
- Wood Siding
Interior Spaces
- 3,545 Sq Ft Home
- Vaulted Ceiling
- Ceiling Fan
- Gas Log Fireplace
- Living Room with Fireplace
- 2 Fireplaces
- Partial Basement
Kitchen
- Breakfast Area or Nook
- Range
- Dishwasher
- Solid Surface Countertops
Bedrooms and Bathrooms
- 3 Bedrooms
- Fireplace in Primary Bedroom
Schools
- Delavan High School
Utilities
- Forced Air Zoned Cooling and Heating System
- Baseboard Heating
- Heating System Uses Natural Gas
- Gas Water Heater
- Septic System
Community Details
- No Home Owners Association
- Templeton Subdivision
Listing and Financial Details
- Assessor Parcel Number 21-21-09-204-006
Map
Tax History
| Year | Tax Paid | Tax Assessment Tax Assessment Total Assessment is a certain percentage of the fair market value that is determined by local assessors to be the total taxable value of land and additions on the property. | Land | Improvement |
|---|---|---|---|---|
| 2025 | $9,111 | $129,790 | $20,220 | $109,570 |
| 2024 | $8,667 | $118,620 | $18,480 | $100,140 |
| 2023 | $8,667 | $107,750 | $16,790 | $90,960 |
| 2022 | $8,117 | $97,870 | $15,250 | $82,620 |
| 2021 | $7,780 | $94,100 | $14,660 | $79,440 |
| 2020 | $7,829 | $94,100 | $14,660 | $79,440 |
| 2019 | $6,048 | $74,100 | $14,660 | $59,440 |
| 2018 | $6,085 | $74,100 | $14,660 | $59,440 |
| 2017 | $3,904 | $46,770 | $14,370 | $32,400 |
| 2016 | $3,865 | $46,770 | $14,370 | $32,400 |
| 2015 | -- | $0 | $0 | $0 |
| 2013 | $2,609 | $46,770 | $14,370 | $32,400 |
Property History
| Date | Event | Price | List to Sale | Price per Sq Ft |
|---|---|---|---|---|
| 02/04/2026 02/04/26 | Price Changed | $350,000 | -5.4% | $99 / Sq Ft |
| 11/11/2025 11/11/25 | Price Changed | $370,000 | -7.5% | $104 / Sq Ft |
| 10/01/2025 10/01/25 | For Sale | $400,000 | -- | $113 / Sq Ft |
Purchase History
We collect this data history from publicly available records. To have your information removed, we recommend requesting removal directly through your county’s website.
| Date | Type | Sale Price | Title Company |
|---|---|---|---|
| Deed | $215,000 | Chicago Title | |
| Interfamily Deed Transfer | -- | None Available |
Mortgage History
We collect this data history from publicly available records. To have your information removed, we recommend requesting removal directly through your county’s website.
| Date | Status | Loan Amount | Loan Type |
|---|---|---|---|
| Open | $172,000 | New Conventional |
Source: RMLS Alliance
MLS Number: PA1261303
APN: 21-21-09-204-006
Disclaimer: Certain information contained herein is derived from information provided by parties other than Homes.com. All information provided is deemed reliable, but is not guaranteed to be accurate and should be independently verified.
![]() All data is obtained from various sources and may not have been verified by broker or MLS GRID. Supplied Open House Information is subject to change without notice. All information should be independently reviewed and verified for accuracy. Properties may or may not be listed by the office/agent presenting the information. Some IDX listings have been excluded from this website.IDX information is provided exclusively for personal, non-commercial use, and may not be used for any purpose other than to identify prospective properties consumers may be interested in purchasing. Information is deemed reliable but not guaranteed.
All data is obtained from various sources and may not have been verified by broker or MLS GRID. Supplied Open House Information is subject to change without notice. All information should be independently reviewed and verified for accuracy. Properties may or may not be listed by the office/agent presenting the information. Some IDX listings have been excluded from this website.IDX information is provided exclusively for personal, non-commercial use, and may not be used for any purpose other than to identify prospective properties consumers may be interested in purchasing. Information is deemed reliable but not guaranteed.
Listings courtesy of RMLS Alliance as distributed by MLS GRID.
Based on information submitted to the MLS GRID
- 318 S Locust St Unit 318-3
- 318 S Locust St Unit 318-1
- 318 S Locust St Unit 318-2
- 322 S Locust St Unit 322-3
- 106 S 4th St
- 1820 Vienna Ct
- 102 N Main Ave Unit 3
- 1320 S 11th St Unit A1
- 100 Ironwood Dr Unit 1
- 712 Summer St
- 1200 Florence Ave
- 1 Williamsburg Ct Unit A
- 5 Williamsburg Ct Unit C
- 1225 Florence Ave
- 11-49 Ruth Cir
- 150 Yordy Rd
- 120 E Queenwood Rd
- 1500 S Missouri Ave
- 216 E Washington St
- 935 E Jefferson St
Ask me questions while you tour the home.