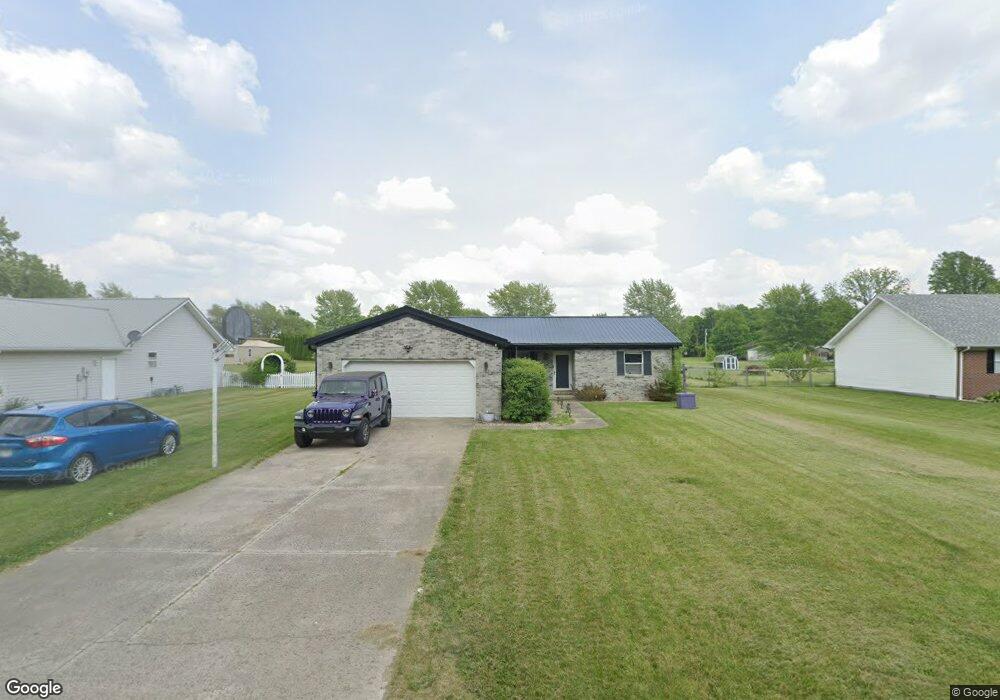
304 N Mulberry St Sulphur Springs, IN 47388
Estimated Value: $220,000 - $270,000
3
Beds
2
Baths
1,620
Sq Ft
$149/Sq Ft
Est. Value
About This Home
This home is located at 304 N Mulberry St, Sulphur Springs, IN 47388 and is currently estimated at $241,599, approximately $149 per square foot. 304 N Mulberry St is a home located in Henry County with nearby schools including Shenandoah Elementary School, Shenandoah Middle School, and Shenandoah High School.
Ownership History
Date
Name
Owned For
Owner Type
Purchase Details
Closed on
Apr 22, 2021
Sold by
Inman Brian C and Inman Diane M
Bought by
Lowry Leanna
Current Estimated Value
Home Financials for this Owner
Home Financials are based on the most recent Mortgage that was taken out on this home.
Original Mortgage
$147,250
Outstanding Balance
$133,055
Interest Rate
3.05%
Mortgage Type
New Conventional
Estimated Equity
$108,544
Purchase Details
Closed on
Jun 2, 2010
Sold by
Patrick Byron and Patrick Kaycie
Bought by
Inman Brian C and Inman Diane M
Home Financials for this Owner
Home Financials are based on the most recent Mortgage that was taken out on this home.
Original Mortgage
$112,978
Interest Rate
5.14%
Mortgage Type
FHA
Purchase Details
Closed on
Aug 31, 2007
Sold by
Patrick April
Bought by
Patrick Byron and Patrick Kaycie
Home Financials for this Owner
Home Financials are based on the most recent Mortgage that was taken out on this home.
Original Mortgage
$114,000
Interest Rate
6.72%
Mortgage Type
New Conventional
Create a Home Valuation Report for This Property
The Home Valuation Report is an in-depth analysis detailing your home's value as well as a comparison with similar homes in the area
Home Values in the Area
Average Home Value in this Area
Purchase History
| Date | Buyer | Sale Price | Title Company |
|---|---|---|---|
| Lowry Leanna | $155,000 | Trademark Title | |
| Inman Brian C | -- | None Available | |
| Patrick Byron | -- | None Available |
Source: Public Records
Mortgage History
| Date | Status | Borrower | Loan Amount |
|---|---|---|---|
| Open | Lowry Leanna | $147,250 | |
| Previous Owner | Inman Brian C | $112,978 | |
| Previous Owner | Patrick Byron | $114,000 |
Source: Public Records
Tax History Compared to Growth
Tax History
| Year | Tax Paid | Tax Assessment Tax Assessment Total Assessment is a certain percentage of the fair market value that is determined by local assessors to be the total taxable value of land and additions on the property. | Land | Improvement |
|---|---|---|---|---|
| 2024 | $1,450 | $181,500 | $38,800 | $142,700 |
| 2023 | $1,405 | $178,700 | $38,800 | $139,900 |
| 2022 | $963 | $124,200 | $22,100 | $102,100 |
| 2021 | $968 | $115,600 | $22,100 | $93,500 |
| 2020 | $962 | $118,100 | $22,100 | $96,000 |
| 2019 | $931 | $116,200 | $22,100 | $94,100 |
| 2018 | $879 | $115,200 | $22,100 | $93,100 |
| 2017 | $779 | $114,400 | $22,100 | $92,300 |
| 2016 | $723 | $112,500 | $22,100 | $90,400 |
| 2014 | $672 | $112,500 | $22,100 | $90,400 |
| 2013 | $672 | $109,400 | $22,100 | $87,300 |
Source: Public Records
Map
Nearby Homes
- 206 W Main St
- 4863 W County Road 600 N
- 3198 N County Road 300 W
- 5579 W US Highway 36
- 6671 N County Road 525 W
- 208 W Main St
- 180 S Summit St
- 2752 W County Road 150 N
- **** N County Road 400 W
- 6990 N Hickory Ln
- 6912 N County Road 700 W
- 200 S East St
- 208 W Main St
- 4905 W State Road 38
- 501 S Hardacre Ct
- 1185 N Mill St
- 1062 N Mill St
- 8482 N Cherry Knoll Dr
- 2504 NW Raintree Dr
- 2447 N East Raintree Dr
- 304 Mulberry St
- 304 N Mulberry St Unit Sulphur Springs
- 302 Mulberry St
- 302 Mulberry St Unit Sulphur Springs
- 306 Mulberry St
- 300 Mulberry St
- 300 N Mulberry St
- 308 Mulberry
- 204 Mulberry
- 305 N Mulberry St
- 404 Spring St
- 308 Spring St
- 308 Spring St
- 306 Spring St
- 310 N Mulberry St
- 304 Spring St
- 302 S Jefferson St
- 204 N Mulberry St
- 204 Baker St
- 204 Baker St Unit 6