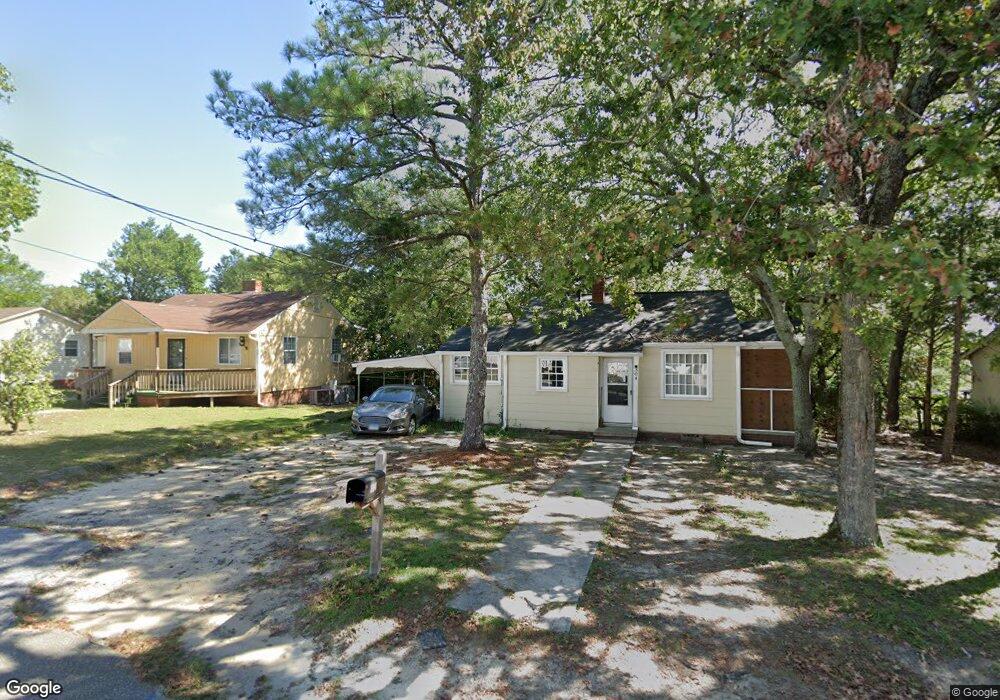
304 N Parson St West Columbia, SC 29169
Estimated Value: $72,806 - $130,000
2
Beds
1
Bath
660
Sq Ft
$139/Sq Ft
Est. Value
About This Home
This home is located at 304 N Parson St, West Columbia, SC 29169 and is currently estimated at $91,935, approximately $139 per square foot. 304 N Parson St is a home located in Lexington County with nearby schools including Riverbank Elementary, Cyril B. Busbee Creative Arts Academy, and Brookland-Cayce High School.
Ownership History
Date
Name
Owned For
Owner Type
Purchase Details
Closed on
Oct 15, 2021
Sold by
Garrick John E
Bought by
Sweetwater Developers Llc
Current Estimated Value
Purchase Details
Closed on
Jun 30, 2021
Sold by
Vpc Investments Llc
Bought by
Garrick John E
Purchase Details
Closed on
Dec 1, 2010
Sold by
Federal Home Loan Mortgage Corporation
Bought by
Vpc Investments Llc
Purchase Details
Closed on
Apr 5, 2010
Sold by
Wilkes Robert C
Bought by
Federal Home Loan Mortgage Corp
Purchase Details
Closed on
Jan 30, 2007
Sold by
Waddell Thomas J and Waddell Pamela M
Bought by
Wilkes Robert C
Home Financials for this Owner
Home Financials are based on the most recent Mortgage that was taken out on this home.
Original Mortgage
$48,000
Interest Rate
6.14%
Mortgage Type
Purchase Money Mortgage
Purchase Details
Closed on
Jun 5, 2001
Sold by
Procter David K
Bought by
Rickenbacker R Nelson
Create a Home Valuation Report for This Property
The Home Valuation Report is an in-depth analysis detailing your home's value as well as a comparison with similar homes in the area
Home Values in the Area
Average Home Value in this Area
Purchase History
| Date | Buyer | Sale Price | Title Company |
|---|---|---|---|
| Sweetwater Developers Llc | $14,000 | None Available | |
| Garrick John E | $43,500 | None Available | |
| Vpc Investments Llc | $11,500 | -- | |
| Federal Home Loan Mortgage Corp | $57,366 | -- | |
| Wilkes Robert C | $48,000 | None Available | |
| Rickenbacker R Nelson | $265,000 | -- |
Source: Public Records
Mortgage History
| Date | Status | Borrower | Loan Amount |
|---|---|---|---|
| Previous Owner | Wilkes Robert C | $48,000 |
Source: Public Records
Tax History Compared to Growth
Tax History
| Year | Tax Paid | Tax Assessment Tax Assessment Total Assessment is a certain percentage of the fair market value that is determined by local assessors to be the total taxable value of land and additions on the property. | Land | Improvement |
|---|---|---|---|---|
| 2024 | $1,123 | $2,610 | $900 | $1,710 |
| 2023 | $1,030 | $2,610 | $900 | $1,710 |
| 2022 | $976 | $2,610 | $900 | $1,710 |
| 2020 | $939 | $2,647 | $825 | $1,822 |
| 2019 | $823 | $2,303 | $900 | $1,403 |
| 2018 | $817 | $2,303 | $900 | $1,403 |
| 2017 | $802 | $2,303 | $900 | $1,403 |
| 2016 | $811 | $2,302 | $900 | $1,402 |
| 2014 | $806 | $2,626 | $900 | $1,726 |
| 2013 | -- | $2,630 | $900 | $1,730 |
Source: Public Records
Map
Nearby Homes