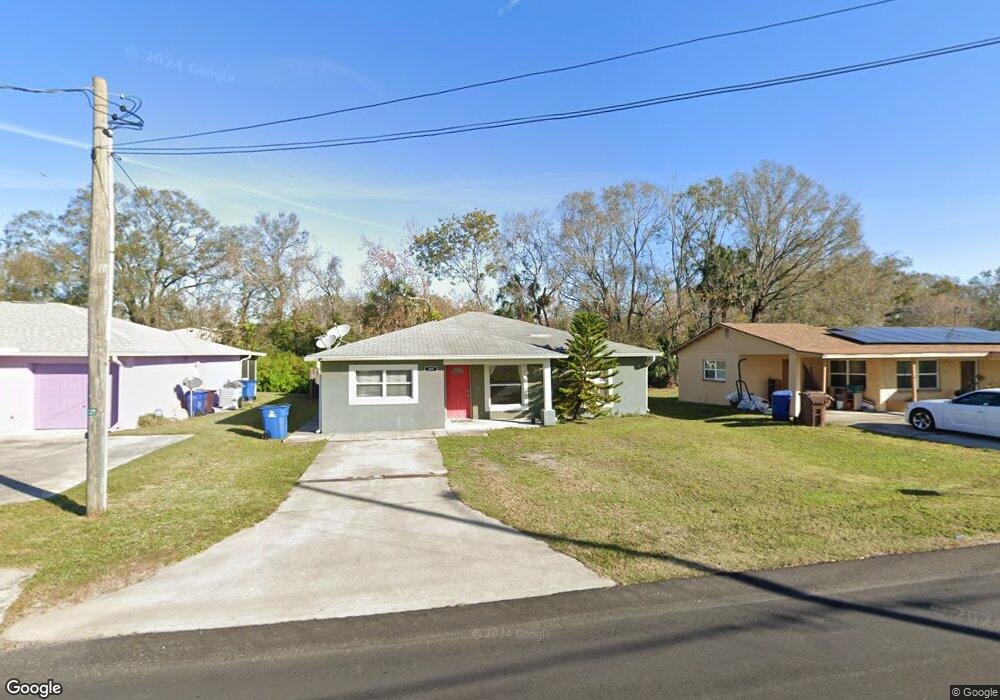
304 NE 5th St Mulberry, FL 33860
Estimated Value: $148,000 - $227,000
3
Beds
2
Baths
951
Sq Ft
$201/Sq Ft
Est. Value
About This Home
This home is located at 304 NE 5th St, Mulberry, FL 33860 and is currently estimated at $191,393, approximately $201 per square foot. 304 NE 5th St is a home located in Polk County with nearby schools including Purcell Elementary School, Bartow Elementary Academy, and Mulberry Middle School.
Ownership History
Date
Name
Owned For
Owner Type
Purchase Details
Closed on
Dec 3, 2014
Sold by
Secretary Of Housing & Urban Development
Bought by
Lopez Rodrigo
Current Estimated Value
Purchase Details
Closed on
Aug 25, 2014
Sold by
Midfirst Bank
Bought by
Secretary Of Housing & Urban Development
Purchase Details
Closed on
Jul 31, 2014
Sold by
Chapple Roger and Chapple Roger A
Bought by
Midfirst Bank
Purchase Details
Closed on
Feb 28, 2005
Sold by
Keystone Challenge Fund Inc
Bought by
Chapple Roger
Home Financials for this Owner
Home Financials are based on the most recent Mortgage that was taken out on this home.
Original Mortgage
$87,290
Interest Rate
5.61%
Mortgage Type
FHA
Create a Home Valuation Report for This Property
The Home Valuation Report is an in-depth analysis detailing your home's value as well as a comparison with similar homes in the area
Home Values in the Area
Average Home Value in this Area
Purchase History
| Date | Buyer | Sale Price | Title Company |
|---|---|---|---|
| Lopez Rodrigo | $52,300 | Island Title Services Inc | |
| Secretary Of Housing & Urban Development | -- | Attorney | |
| Midfirst Bank | $28,100 | None Available | |
| Chapple Roger | $98,000 | -- |
Source: Public Records
Mortgage History
| Date | Status | Borrower | Loan Amount |
|---|---|---|---|
| Previous Owner | Chapple Roger | $87,290 | |
| Closed | Chapple Roger | $11,000 |
Source: Public Records
Tax History
| Year | Tax Paid | Tax Assessment Tax Assessment Total Assessment is a certain percentage of the fair market value that is determined by local assessors to be the total taxable value of land and additions on the property. | Land | Improvement |
|---|---|---|---|---|
| 2025 | $2,887 | $141,703 | -- | -- |
| 2024 | $2,759 | $128,821 | -- | -- |
| 2023 | $2,759 | $117,110 | $0 | $0 |
| 2022 | $2,477 | $106,464 | $0 | $0 |
| 2021 | $2,194 | $96,785 | $0 | $0 |
| 2020 | $1,997 | $87,986 | $10,500 | $77,486 |
| 2018 | $1,779 | $78,640 | $10,000 | $68,640 |
| 2017 | $1,703 | $68,624 | $0 | $0 |
| 2016 | $1,564 | $62,385 | $0 | $0 |
Source: Public Records
Map
Nearby Homes
- 111 NE 1st Ave
- 503 NW 1st Ave Unit A & B
- 202 E Badcock Blvd
- 602 NW 1st Ave
- 109 NE 4th Ave
- 707 NW 2nd Ave
- 1119 Aruba Ave
- 404 NW 7th St
- 406 NW 7th St
- 1056 Aruba Ave
- 407 NW 8th St
- 216 NW 4th Ave
- 1002 NE 1st St
- 1001 NE 1st St
- 600 SE 3rd St
- 1107 NE 5th St
- 996 Aruba Ave
- 141 NW 10th Dr
- 301 SW 3rd Terrace
- 409 SW 2nd Ave
Your Personal Tour Guide
Ask me questions while you tour the home.