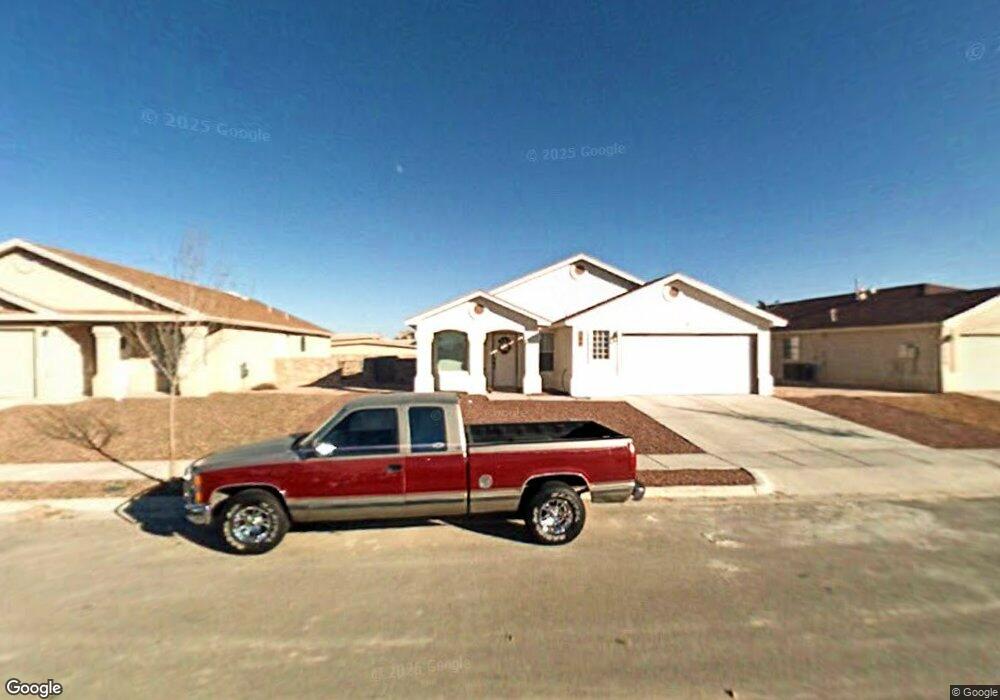
304 Peter Noyes Dr El Paso, TX 79928
Estimated Value: $200,423 - $212,000
3
Beds
2
Baths
1,344
Sq Ft
$154/Sq Ft
Est. Value
About This Home
This home is located at 304 Peter Noyes Dr, El Paso, TX 79928 and is currently estimated at $206,856, approximately $153 per square foot. 304 Peter Noyes Dr is a home located in El Paso County with nearby schools including Desert Hills Elementary School, Horizon Middle School, and Horizon High School.
Ownership History
Date
Name
Owned For
Owner Type
Purchase Details
Closed on
Feb 7, 2024
Sold by
Arnold Dora L
Bought by
Bonanza Ddm Llc
Current Estimated Value
Purchase Details
Closed on
Dec 21, 2021
Sold by
Arnold Dora L and Bonanza Mdd Llc
Bought by
Arnold Dora L
Purchase Details
Closed on
Oct 22, 2014
Sold by
Arnold Dora L
Bought by
Bonanza Mdd Llc
Purchase Details
Closed on
Jun 16, 2010
Sold by
Aurora Loan Services Llc
Bought by
Arnold Dora Lilia
Purchase Details
Closed on
Jan 5, 2010
Sold by
Martinez Lizet
Bought by
Aurora Loan Services Llc
Purchase Details
Closed on
Aug 3, 2007
Sold by
Saratoga Homes Horizon Llc
Bought by
Martinez Lizet
Home Financials for this Owner
Home Financials are based on the most recent Mortgage that was taken out on this home.
Original Mortgage
$108,950
Interest Rate
6.69%
Mortgage Type
Purchase Money Mortgage
Create a Home Valuation Report for This Property
The Home Valuation Report is an in-depth analysis detailing your home's value as well as a comparison with similar homes in the area
Home Values in the Area
Average Home Value in this Area
Purchase History
| Date | Buyer | Sale Price | Title Company |
|---|---|---|---|
| Bonanza Ddm Llc | -- | None Listed On Document | |
| Arnold Dora L | -- | None Available | |
| Bonanza Mdd Llc | -- | None Available | |
| Arnold Dora Lilia | -- | Lsi Title Agency Inc | |
| Aurora Loan Services Llc | $118,397 | None Available | |
| Martinez Lizet | -- | None Available |
Source: Public Records
Mortgage History
| Date | Status | Borrower | Loan Amount |
|---|---|---|---|
| Previous Owner | Martinez Lizet | $108,950 |
Source: Public Records
Tax History Compared to Growth
Tax History
| Year | Tax Paid | Tax Assessment Tax Assessment Total Assessment is a certain percentage of the fair market value that is determined by local assessors to be the total taxable value of land and additions on the property. | Land | Improvement |
|---|---|---|---|---|
| 2025 | $6,320 | $196,814 | $23,713 | $173,101 |
| 2024 | $6,320 | $196,814 | $23,713 | $173,101 |
| 2023 | $5,936 | $187,704 | $23,713 | $163,991 |
| 2022 | $5,587 | $172,300 | $23,713 | $148,587 |
| 2021 | $5,301 | $148,555 | $23,713 | $124,842 |
| 2020 | $4,045 | $116,452 | $23,713 | $92,739 |
| 2018 | $3,947 | $117,596 | $23,713 | $93,883 |
| 2017 | $3,507 | $105,602 | $23,713 | $81,889 |
| 2016 | $3,507 | $105,602 | $23,713 | $81,889 |
| 2015 | $3,317 | $105,602 | $23,713 | $81,889 |
| 2014 | $3,317 | $104,988 | $23,713 | $81,275 |
Source: Public Records
Map
Nearby Homes
- TBD Rodman St
- 317 Jim Knowles Place
- 0 Highweed Dr Unit 918787
- 14005 Lago Azul St
- 14032 Highweed Dr
- PN-31080 Tbd
- 13977 Veny Webb St
- 394 Brill Cir
- 14052 Highweed Dr
- 409 Desert Chicory St
- 150 Rodman
- 0 Fallon Rd Unit 928403
- 390 Medill Place
- 14100 Ghost Flower St
- 156 Lago Grande Dr
- 441 Desert Dandelion St
- 14117 Highweed Dr
- TBD Emigrant Rd
- 400 Mura Place
- 14156 Warren Belin Dr
- 308 Peter Noyes Dr
- 300 Peter Noyes Dr
- 14005 Stoutland Ln
- 312 Peter Noyes Dr
- 14001 Stoutland Ln
- 14009 Stoutland Ln
- 309 Peter Noyes Dr
- 301 Peter Noyes Dr
- 316 Peter Noyes Dr
- 313 Peter Noyes Dr
- 14013 Stoutland Ln
- 14000 Stoutland Ln
- 317 Peter Noyes Dr
- 14020 Warren Belin Dr
- 14017 Stoutland Ln
- 321 Peter Noyes Dr
- 14000 Peter Noyes Dr
- 14024 Warren Belin Dr
- 14004 Stoutland Ln
- 325 Peter Noyes Dr