304 Pleasant St Southbridge, MA 01550
Estimated payment $2,153/month
Highlights
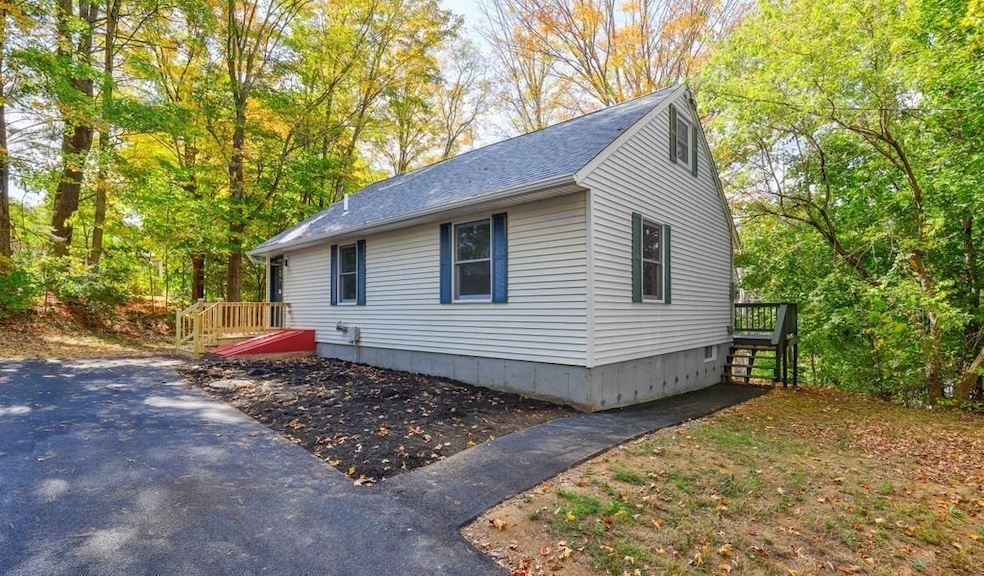
- Cape Cod Architecture
- Property is near public transit
- Corner Lot
- Deck
- Attic
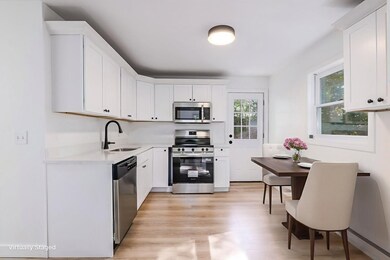
- Solid Surface Countertops
About This Home
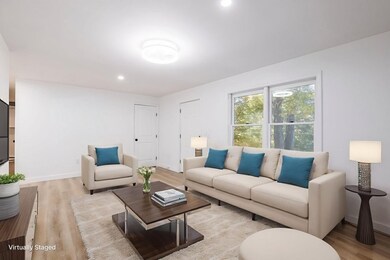
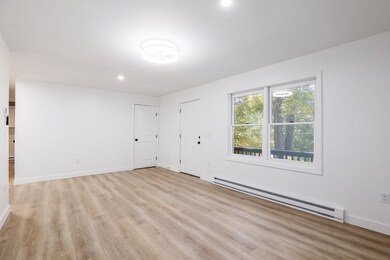
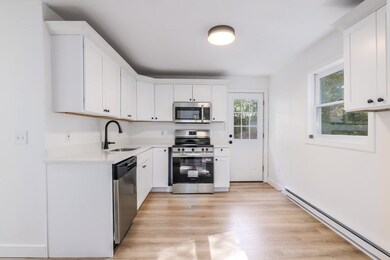
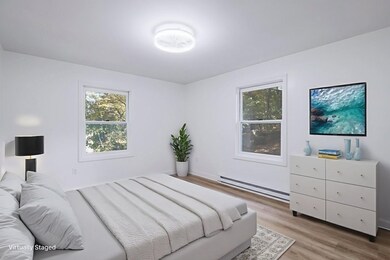
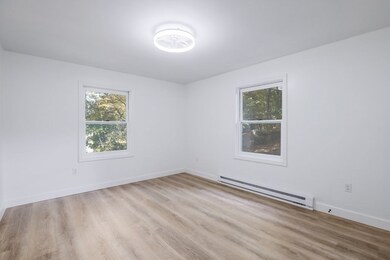
Beautifully updated Cape on a spacious corner lot, offering the perfect blend of charm and modern comfort! Showcasing quality upgrades inside and out! Step inside to find a freshly painted interior with new vinyl flooring and a stunning upgraded kitchen featuring brand-new cabinets, quartz countertops, and stainless-steel appliances. The bathroom has been tastefully updated with modern finishes for a clean, refreshed look. Exterior improvements include a new roof, new gutters, new asphalt driveway and walkways, plus enhanced front stairs and rear deck perfect for relaxing or entertaining. This move-in-ready home offers exceptional curb appeal and low-maintenance living. Conveniently located near local schools, shops, and parks with easy access to major routes. A perfect combination of classic Cape charm and modern comfort—welcome home. ALL OFFERS to be reviewed on Monday October 20, 2025

Home Details
Home Type
- Single Family
Est. Annual Taxes
- $3,977
Year Built
- Built in 1988 | Remodeled
Lot Details
- 10,454 Sq Ft Lot
- Corner Lot
- Property is zoned R1
Home Design
- Cape Cod Architecture
- Frame Construction
- Blown-In Insulation
- Batts Insulation
- Shingle Roof
- Concrete Perimeter Foundation
Interior Spaces
- 1,068 Sq Ft Home
- Ceiling Fan
- Recessed Lighting
- Insulated Windows
- Bay Window
- Insulated Doors
- Washer and Electric Dryer Hookup
- Attic
Kitchen
- Range
- Microwave
- Dishwasher
- Solid Surface Countertops
Flooring
- Carpet
- Vinyl
Bedrooms and Bathrooms
- 2 Bedrooms
- 1 Full Bathroom
Unfinished Basement
- Basement Fills Entire Space Under The House
- Interior and Exterior Basement Entry
- Block Basement Construction
Parking
- 3 Car Parking Spaces
- Tandem Parking
- Driveway
- Paved Parking
- Open Parking
Outdoor Features
- Bulkhead
- Balcony
- Deck
- Rain Gutters
Location
- Property is near public transit
Utilities
- Whole House Fan
- Electric Baseboard Heater
- 200+ Amp Service
- Electric Water Heater
Community Details
- No Home Owners Association
- Shops
Listing and Financial Details
- Assessor Parcel Number M:0020 B:0015 L:00001,3976701
Map
Home Values in the Area
Average Home Value in this Area
Tax History
| Year | Tax Paid | Tax Assessment Tax Assessment Total Assessment is a certain percentage of the fair market value that is determined by local assessors to be the total taxable value of land and additions on the property. | Land | Improvement |
|---|---|---|---|---|
| 2025 | $3,977 | $271,300 | $34,800 | $236,500 |
| 2024 | $3,887 | $254,700 | $29,000 | $225,700 |
| 2023 | $3,821 | $241,200 | $29,000 | $212,200 |
| 2022 | $3,589 | $200,500 | $24,800 | $175,700 |
| 2021 | $12,184 | $185,900 | $24,800 | $161,100 |
| 2020 | $3,337 | $171,300 | $24,800 | $146,500 |
| 2018 | $2,893 | $139,400 | $22,000 | $117,400 |
| 2017 | $2,851 | $138,600 | $22,000 | $116,600 |
| 2016 | $2,613 | $129,300 | $22,000 | $107,300 |
| 2015 | $2,608 | $128,100 | $22,000 | $106,100 |
| 2014 | $2,412 | $122,800 | $22,000 | $100,800 |
Property History
| Date | Event | Price | List to Sale | Price per Sq Ft |
|---|---|---|---|---|
| 10/22/2025 10/22/25 | Pending | -- | -- | -- |
| 10/14/2025 10/14/25 | For Sale | $345,000 | -- | $323 / Sq Ft |
Purchase History
| Date | Type | Sale Price | Title Company |
|---|---|---|---|
| Quit Claim Deed | $195,000 | -- | |
| Quit Claim Deed | $195,000 | -- | |
| Quit Claim Deed | $128,000 | None Available | |
| Quit Claim Deed | $128,000 | None Available | |
| Deed | $87,500 | -- | |
| Deed | $87,500 | -- |
Mortgage History
| Date | Status | Loan Amount | Loan Type |
|---|---|---|---|
| Open | $190,005 | Purchase Money Mortgage | |
| Closed | $190,005 | Purchase Money Mortgage | |
| Previous Owner | $126,800 | No Value Available | |
| Previous Owner | $77,000 | No Value Available | |
| Previous Owner | $83,000 | Purchase Money Mortgage |
Source: MLS Property Information Network (MLS PIN)
MLS Number: 73443295
APN: SBRI-000020-000015-000001
Disclaimer: Certain information contained herein is derived from information provided by parties other than Homes.com. All information provided is deemed reliable, but is not guaranteed to be accurate and should be independently verified.
![]() The property listing data and information, or the Images, set forth herein were provided to MLS Property Information Network, Inc. from third party sources, including sellers, lessors and public records, and were compiled by MLS Property Information Network, Inc. The property listing data and information, and the Images, are for the personal, non-commercial use of consumers having a good faith interest in purchasing or leasing listed properties of the type displayed to them and may not be used for any purpose other than to identify prospective properties which such consumers may have a good faith interest in purchasing or leasing. MLS Property Information Network, Inc. and its subscribers disclaim any and all representations and warranties as to the accuracy of the property listing data and information, or as to the accuracy of any of the Images, set forth herein.
The property listing data and information, or the Images, set forth herein were provided to MLS Property Information Network, Inc. from third party sources, including sellers, lessors and public records, and were compiled by MLS Property Information Network, Inc. The property listing data and information, and the Images, are for the personal, non-commercial use of consumers having a good faith interest in purchasing or leasing listed properties of the type displayed to them and may not be used for any purpose other than to identify prospective properties which such consumers may have a good faith interest in purchasing or leasing. MLS Property Information Network, Inc. and its subscribers disclaim any and all representations and warranties as to the accuracy of the property listing data and information, or as to the accuracy of any of the Images, set forth herein.
- 111 Plimpton St
- 216 Fiske St
- 292 Cournoyer Blvd
- 29 Fiske St
- 6 Walcott St
- 127 Cliff St
- 150 Clemence Hill Rd
- 45 River St
- 6 Berry Farms Rd Unit 64
- 6 Berry Farms Rd Unit 3
- 6 Berry Farms Rd Unit 63
- 6 Berry Farms Rd Unit 6
- 757 Main St
- 723 Main St
- 3 Berry Farms Road - Jv
- 20 Sayles St
- 72 High St
- Lot 1 Berry Farms Road-2 Acre
- 21 Edwards St
- 21 Orchard St