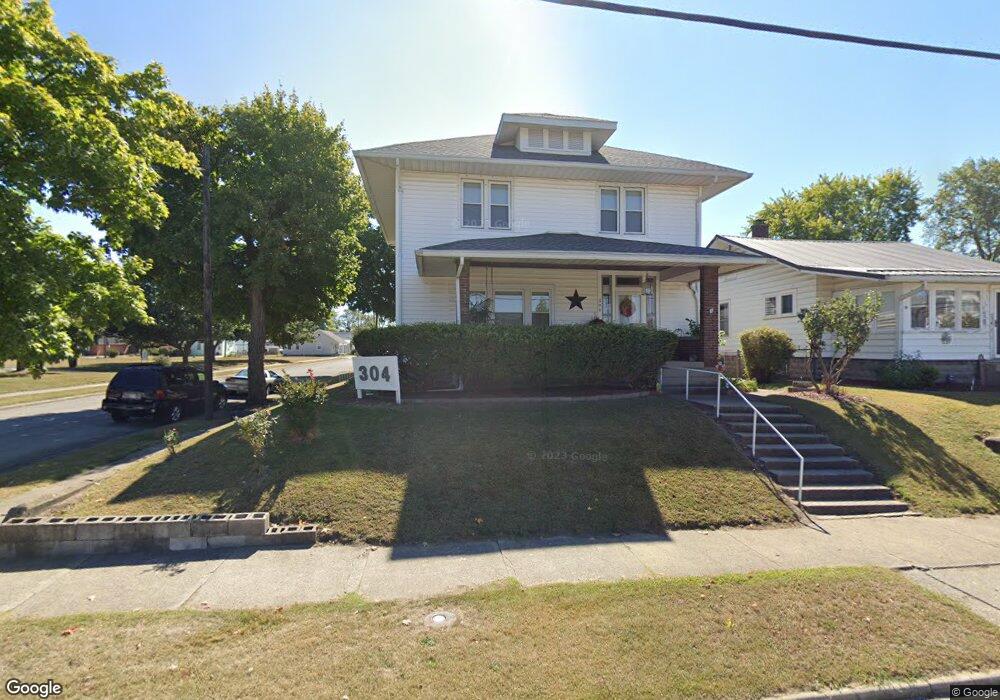
304 S 9th St Vincennes, IN 47591
Estimated Value: $159,349 - $185,000
5
Beds
2
Baths
2,660
Sq Ft
$63/Sq Ft
Est. Value
About This Home
This home is located at 304 S 9th St, Vincennes, IN 47591 and is currently estimated at $166,587, approximately $62 per square foot. 304 S 9th St is a home located in Knox County with nearby schools including Lincoln High School, Flaget Elementary School, and Rivet Middle/High School.
Ownership History
Date
Name
Owned For
Owner Type
Purchase Details
Closed on
Feb 26, 2020
Sold by
Evans James V
Bought by
Lester Barry G
Current Estimated Value
Home Financials for this Owner
Home Financials are based on the most recent Mortgage that was taken out on this home.
Original Mortgage
$106,060
Outstanding Balance
$94,109
Interest Rate
3.6%
Mortgage Type
Construction
Estimated Equity
$72,478
Purchase Details
Closed on
Jul 27, 2009
Sold by
Roger Robison
Bought by
Evans James V and Evans Darlus J
Create a Home Valuation Report for This Property
The Home Valuation Report is an in-depth analysis detailing your home's value as well as a comparison with similar homes in the area
Home Values in the Area
Average Home Value in this Area
Purchase History
| Date | Buyer | Sale Price | Title Company |
|---|---|---|---|
| Lester Barry G | $105,000 | -- | |
| Barry Lester G | $105,000 | Attorney Only | |
| Evans James V | $49,900 | -- |
Source: Public Records
Mortgage History
| Date | Status | Borrower | Loan Amount |
|---|---|---|---|
| Open | Barry Lester G | $106,060 | |
| Closed | Lester Barry G | -- |
Source: Public Records
Tax History Compared to Growth
Tax History
| Year | Tax Paid | Tax Assessment Tax Assessment Total Assessment is a certain percentage of the fair market value that is determined by local assessors to be the total taxable value of land and additions on the property. | Land | Improvement |
|---|---|---|---|---|
| 2024 | $1,332 | $129,200 | $6,300 | $122,900 |
| 2023 | $1,346 | $126,700 | $6,300 | $120,400 |
| 2022 | $1,146 | $110,500 | $6,300 | $104,200 |
| 2021 | $930 | $89,400 | $6,300 | $83,100 |
| 2020 | $710 | $72,100 | $6,300 | $65,800 |
| 2019 | $620 | $63,400 | $5,200 | $58,200 |
| 2018 | $602 | $64,900 | $5,200 | $59,700 |
| 2017 | $590 | $64,200 | $5,200 | $59,000 |
| 2016 | $596 | $64,200 | $5,200 | $59,000 |
| 2014 | $512 | $61,100 | $5,200 | $55,900 |
| 2013 | $549 | $63,200 | $800 | $62,400 |
Source: Public Records
Map
Nearby Homes
- 715 Vigo St
- 607 Barnett St
- 314 S 6th St
- 1205 Nicholas St Unit 2
- 1302 Busseron St
- 624,628,634,638 Broadway St
- 1409 Main St
- 307 Church St
- 1408 Main St
- 718 Buntin St
- 1304 Broadway St
- 1309 Wheeler St
- 1218 Buntin St
- 809 S 15th St
- 1320 Perry St
- 704 N 9th St
- 402 N 15th St
- 615 N 5th St
- 1536 Joice St
- 804 N 5th St