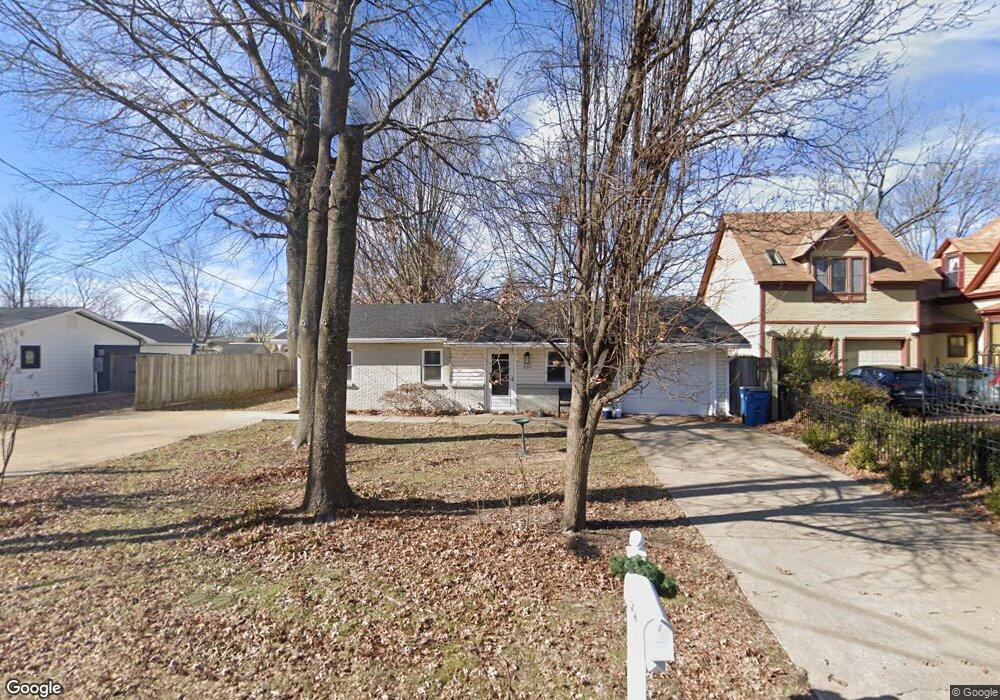
304 SE B St Bentonville, AR 72712
Estimated Value: $678,958 - $824,000
--
Bed
2
Baths
1,104
Sq Ft
$675/Sq Ft
Est. Value
About This Home
This home is located at 304 SE B St, Bentonville, AR 72712 and is currently estimated at $745,240, approximately $675 per square foot. 304 SE B St is a home located in Benton County with nearby schools including R.E. Baker Elementary School, Old High Middle School, and Washington Junior High School.
Ownership History
Date
Name
Owned For
Owner Type
Purchase Details
Closed on
Sep 4, 2015
Sold by
Matthews Betty and Matthews Lee Roy
Bought by
The John & Eve Adams Revocable Trust
Current Estimated Value
Purchase Details
Closed on
Jan 6, 2004
Bought by
Matthews
Purchase Details
Closed on
Jun 13, 2002
Bought by
Moore
Purchase Details
Closed on
May 30, 2002
Bought by
Matthews
Purchase Details
Closed on
Mar 8, 1999
Bought by
Moore
Purchase Details
Closed on
Mar 21, 1983
Bought by
Cain
Create a Home Valuation Report for This Property
The Home Valuation Report is an in-depth analysis detailing your home's value as well as a comparison with similar homes in the area
Home Values in the Area
Average Home Value in this Area
Purchase History
| Date | Buyer | Sale Price | Title Company |
|---|---|---|---|
| The John & Eve Adams Revocable Trust | $115,000 | First National Title Company | |
| Matthews | $76,000 | -- | |
| Matthews | $76,000 | -- | |
| Moore | -- | -- | |
| Matthews | $78,000 | -- | |
| Moore | $62,000 | -- | |
| Cain | $38,000 | -- |
Source: Public Records
Tax History Compared to Growth
Tax History
| Year | Tax Paid | Tax Assessment Tax Assessment Total Assessment is a certain percentage of the fair market value that is determined by local assessors to be the total taxable value of land and additions on the property. | Land | Improvement |
|---|---|---|---|---|
| 2025 | $3,221 | $120,486 | $72,569 | $47,917 |
| 2024 | $2,966 | $120,486 | $72,569 | $47,917 |
| 2023 | $2,697 | $55,710 | $42,950 | $12,760 |
| 2022 | $2,550 | $55,710 | $42,950 | $12,760 |
| 2021 | $2,329 | $55,710 | $42,950 | $12,760 |
| 2020 | $2,138 | $33,560 | $26,660 | $6,900 |
| 2019 | $2,138 | $33,560 | $26,660 | $6,900 |
| 2018 | $2,138 | $33,560 | $26,660 | $6,900 |
| 2017 | $2,071 | $33,560 | $26,660 | $6,900 |
| 2016 | $2,071 | $33,560 | $26,660 | $6,900 |
| 2015 | $824 | $17,690 | $4,000 | $13,690 |
| 2014 | $474 | $17,690 | $4,000 | $13,690 |
Source: Public Records
Map
Nearby Homes