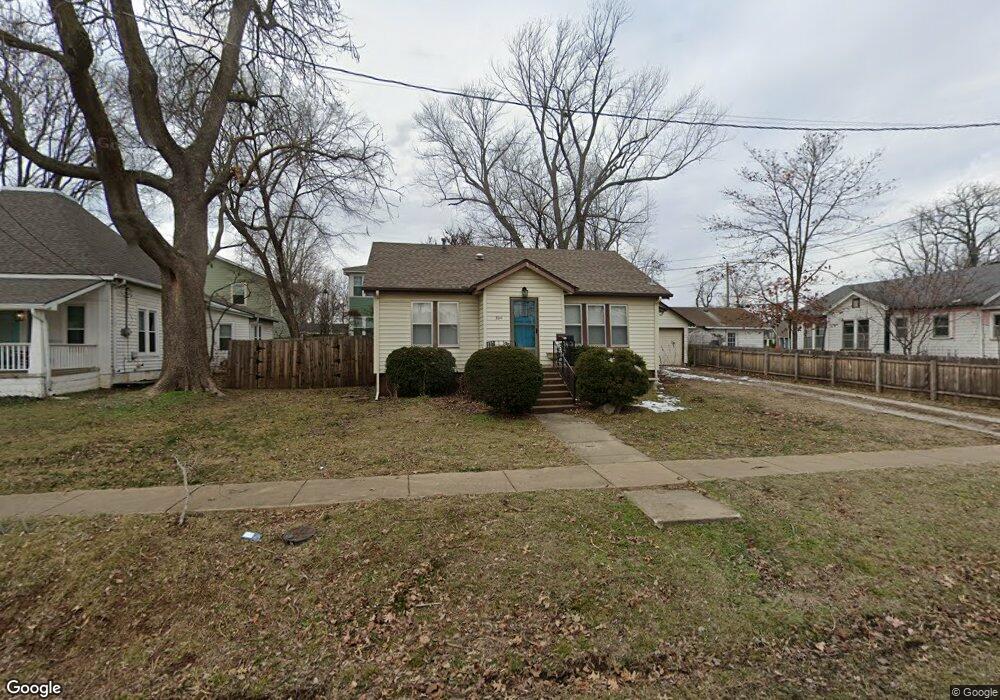
304 SE C St Bentonville, AR 72712
Estimated Value: $585,795 - $827,000
--
Bed
1
Bath
992
Sq Ft
$673/Sq Ft
Est. Value
About This Home
This home is located at 304 SE C St, Bentonville, AR 72712 and is currently estimated at $667,949, approximately $673 per square foot. 304 SE C St is a home located in Benton County with nearby schools including R.E. Baker Elementary School, Old High Middle School, and Washington Junior High School.
Ownership History
Date
Name
Owned For
Owner Type
Purchase Details
Closed on
Jan 28, 2022
Sold by
Fischer Richard W and Fischer Tina
Bought by
Herring Michael and Herring Dorcas
Current Estimated Value
Home Financials for this Owner
Home Financials are based on the most recent Mortgage that was taken out on this home.
Original Mortgage
$402,573
Outstanding Balance
$370,804
Interest Rate
3.22%
Mortgage Type
FHA
Estimated Equity
$297,145
Create a Home Valuation Report for This Property
The Home Valuation Report is an in-depth analysis detailing your home's value as well as a comparison with similar homes in the area
Home Values in the Area
Average Home Value in this Area
Purchase History
| Date | Buyer | Sale Price | Title Company |
|---|---|---|---|
| Herring Michael | $410,000 | First National Title |
Source: Public Records
Mortgage History
| Date | Status | Borrower | Loan Amount |
|---|---|---|---|
| Open | Herring Michael | $402,573 |
Source: Public Records
Tax History Compared to Growth
Tax History
| Year | Tax Paid | Tax Assessment Tax Assessment Total Assessment is a certain percentage of the fair market value that is determined by local assessors to be the total taxable value of land and additions on the property. | Land | Improvement |
|---|---|---|---|---|
| 2025 | $1,947 | $94,897 | $59,760 | $35,137 |
| 2024 | $1,793 | $94,897 | $59,760 | $35,137 |
| 2023 | $1,630 | $45,390 | $35,370 | $10,020 |
| 2022 | $1,541 | $45,390 | $35,370 | $10,020 |
| 2021 | $1,408 | $45,390 | $35,370 | $10,020 |
| 2020 | $1,292 | $27,360 | $21,950 | $5,410 |
| 2019 | $1,206 | $27,360 | $21,950 | $5,410 |
| 2018 | $1,120 | $27,360 | $21,950 | $5,410 |
| 2017 | $918 | $27,360 | $21,950 | $5,410 |
| 2016 | $918 | $27,360 | $21,950 | $5,410 |
| 2015 | $836 | $13,530 | $4,000 | $9,530 |
| 2014 | $836 | $13,530 | $4,000 | $9,530 |
Source: Public Records
Map
Nearby Homes