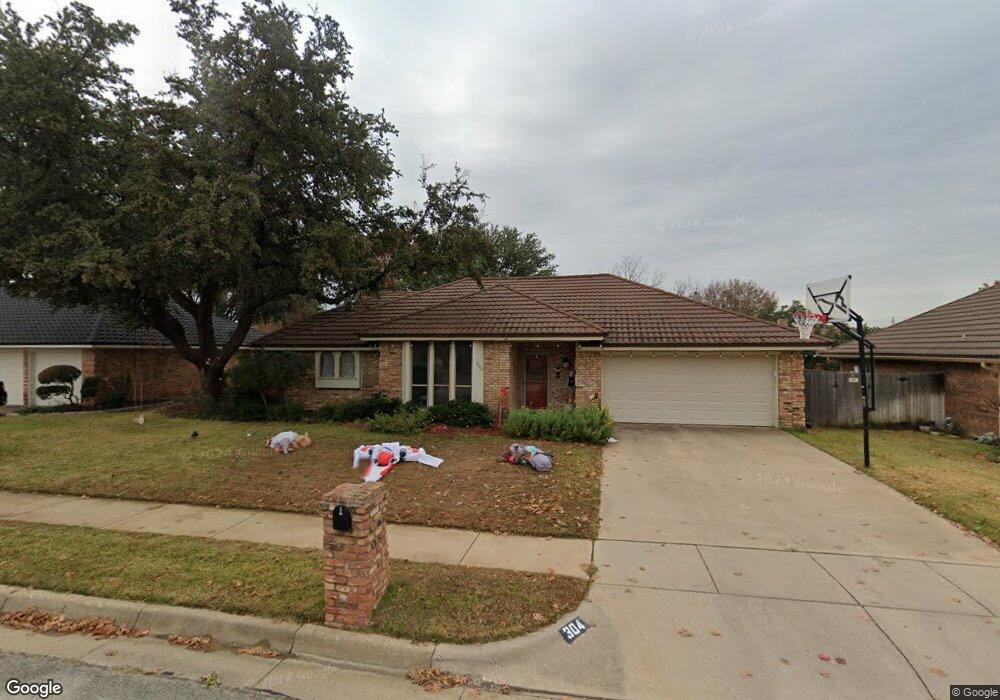
304 Shenandoah Ct Bedford, TX 76021
Estimated Value: $439,000 - $477,000
4
Beds
2
Baths
2,337
Sq Ft
$196/Sq Ft
Est. Value
About This Home
This home is located at 304 Shenandoah Ct, Bedford, TX 76021 and is currently estimated at $457,068, approximately $195 per square foot. 304 Shenandoah Ct is a home located in Tarrant County with nearby schools including Bedford Heights Elementary School, Bedford Junior High School, and L.D. Bell High School.
Ownership History
Date
Name
Owned For
Owner Type
Purchase Details
Closed on
Jul 31, 2013
Sold by
Glaze Vicki M and Glaze Vicki
Bought by
Creecy Brandon P and Creecy Jennifer A
Current Estimated Value
Home Financials for this Owner
Home Financials are based on the most recent Mortgage that was taken out on this home.
Original Mortgage
$170,550
Outstanding Balance
$124,467
Interest Rate
3.93%
Mortgage Type
New Conventional
Estimated Equity
$332,601
Purchase Details
Closed on
Nov 19, 1996
Sold by
Watson Joseph M and Watson Karen H
Bought by
Glaze Ross M and Glaze Vicki M
Home Financials for this Owner
Home Financials are based on the most recent Mortgage that was taken out on this home.
Original Mortgage
$104,800
Interest Rate
7.84%
Purchase Details
Closed on
Mar 23, 1994
Sold by
Watson Joseph M and Watson Karen H
Bought by
Watson Joseph M and Watson Karen H
Create a Home Valuation Report for This Property
The Home Valuation Report is an in-depth analysis detailing your home's value as well as a comparison with similar homes in the area
Home Values in the Area
Average Home Value in this Area
Purchase History
| Date | Buyer | Sale Price | Title Company |
|---|---|---|---|
| Creecy Brandon P | -- | None Available | |
| Glaze Ross M | -- | Commonwealth Land Title | |
| Watson Joseph M | -- | -- |
Source: Public Records
Mortgage History
| Date | Status | Borrower | Loan Amount |
|---|---|---|---|
| Open | Creecy Brandon P | $170,550 | |
| Previous Owner | Glaze Ross M | $104,800 |
Source: Public Records
Tax History Compared to Growth
Tax History
| Year | Tax Paid | Tax Assessment Tax Assessment Total Assessment is a certain percentage of the fair market value that is determined by local assessors to be the total taxable value of land and additions on the property. | Land | Improvement |
|---|---|---|---|---|
| 2025 | $5,907 | $349,000 | $75,000 | $274,000 |
| 2024 | $5,907 | $370,000 | $75,000 | $295,000 |
| 2023 | $6,940 | $383,899 | $55,000 | $328,899 |
| 2022 | $7,185 | $360,897 | $55,000 | $305,897 |
| 2021 | $7,044 | $299,041 | $55,000 | $244,041 |
| 2020 | $7,110 | $299,041 | $55,000 | $244,041 |
| 2019 | $6,790 | $304,900 | $55,000 | $249,900 |
| 2018 | $5,791 | $254,090 | $55,000 | $199,090 |
| 2017 | $5,588 | $230,991 | $18,000 | $212,991 |
| 2016 | $5,216 | $219,857 | $18,000 | $201,857 |
| 2015 | $4,647 | $196,000 | $18,000 | $178,000 |
| 2014 | $4,647 | $198,600 | $18,000 | $180,600 |
Source: Public Records
Map
Nearby Homes
- 320 Blue Quail Ct
- 305 Warbler Dr
- 405 Woodbriar Ct
- 3213 Spring Valley Dr
- 432 Sunnybrook Ct
- 3119 Spring Grove Dr
- 3605 Spring Valley Dr
- 801 Shady Creek Ln
- 913 Kensington Ct
- 404 Heather Ln
- 121 Kay Ct
- 3713 Brentwood Ct
- 3609 Wayne Ct
- 922 Shady Creek Ln
- 628 Huntwich Dr
- 124 Jeannie Ct
- 817 Shady Lake Dr
- 2212 Mountainview Dr
- 1732 Jeannie Ln
- 3624 Wayne Ct
- 300 Shenandoah Ct
- 308 Shenandoah Ct
- 305 Stanford Ct
- 301 Stanford Ct
- 309 Stanford Ct
- 312 Shenandoah Ct
- 305 Shenandoah Ct
- 301 Shenandoah Ct
- 309 Shenandoah Ct
- 313 Stanford Ct
- 3124 Shenandoah Dr
- 313 Shenandoah Ct
- 213 Stanford Dr
- 316 Shenandoah Ct
- 3125 Shenandoah Dr
- 317 Stanford Ct
- 304 Stanford Ct
- 304 Blue Quail Ct
- 300 Stanford Ct
- 308 Stanford Ct