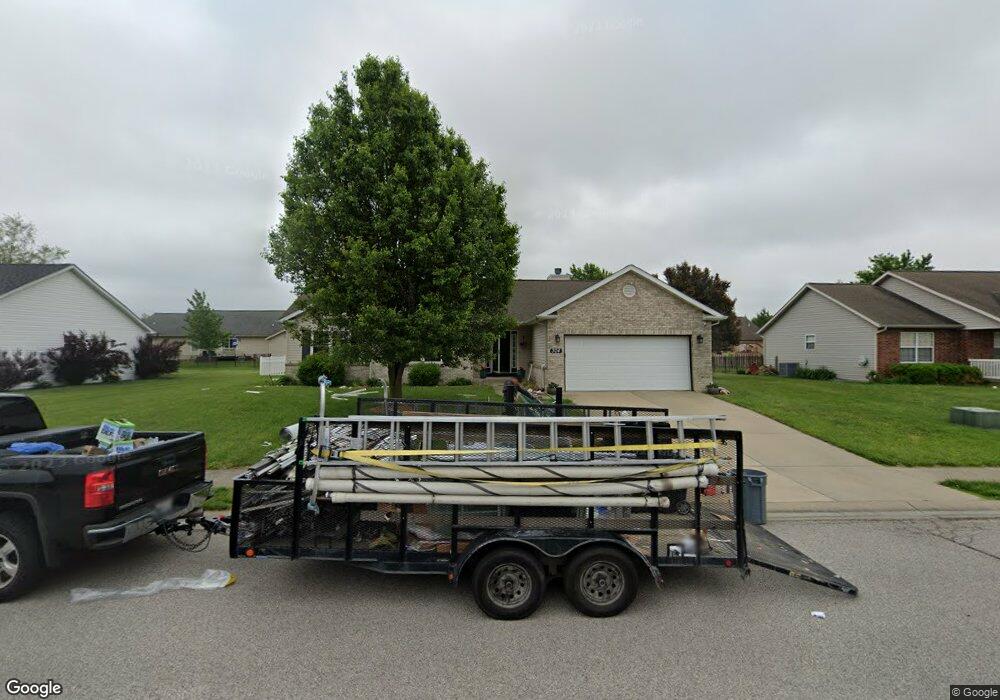
304 Silverthorne Dr Freeburg, IL 62243
Estimated Value: $303,276 - $360,000
3
Beds
2
Baths
1,821
Sq Ft
$183/Sq Ft
Est. Value
About This Home
This home is located at 304 Silverthorne Dr, Freeburg, IL 62243 and is currently estimated at $333,819, approximately $183 per square foot. 304 Silverthorne Dr is a home located in St. Clair County with nearby schools including Freeburg Elementary School, Freeburg Community High School, and St. Joseph Catholic School.
Ownership History
Date
Name
Owned For
Owner Type
Purchase Details
Closed on
May 6, 2011
Sold by
The Secretary Of Housing & Urban Develop
Bought by
Rutmanis Darren G and Rutmanis Shelley R
Current Estimated Value
Home Financials for this Owner
Home Financials are based on the most recent Mortgage that was taken out on this home.
Original Mortgage
$166,170
Outstanding Balance
$114,786
Interest Rate
4.75%
Mortgage Type
FHA
Estimated Equity
$219,033
Purchase Details
Closed on
Sep 2, 2010
Sold by
Funken Brandon G
Bought by
The Secretary Of Housing & Urban Develop
Purchase Details
Closed on
Jul 9, 2004
Sold by
Beck Lorren
Bought by
Funken Brandon G and Funken Laurie A
Home Financials for this Owner
Home Financials are based on the most recent Mortgage that was taken out on this home.
Original Mortgage
$167,275
Interest Rate
6.39%
Mortgage Type
FHA
Create a Home Valuation Report for This Property
The Home Valuation Report is an in-depth analysis detailing your home's value as well as a comparison with similar homes in the area
Home Values in the Area
Average Home Value in this Area
Purchase History
| Date | Buyer | Sale Price | Title Company |
|---|---|---|---|
| Rutmanis Darren G | -- | Lakeside Title & Escrow Agen | |
| The Secretary Of Housing & Urban Develop | -- | None Available | |
| Funken Brandon G | $170,000 | Pti |
Source: Public Records
Mortgage History
| Date | Status | Borrower | Loan Amount |
|---|---|---|---|
| Open | Rutmanis Darren G | $166,170 | |
| Previous Owner | Funken Brandon G | $167,275 |
Source: Public Records
Tax History Compared to Growth
Tax History
| Year | Tax Paid | Tax Assessment Tax Assessment Total Assessment is a certain percentage of the fair market value that is determined by local assessors to be the total taxable value of land and additions on the property. | Land | Improvement |
|---|---|---|---|---|
| 2024 | $6,174 | $80,768 | $16,390 | $64,378 |
| 2023 | $5,793 | $75,070 | $15,234 | $59,836 |
| 2022 | $5,404 | $68,897 | $13,981 | $54,916 |
| 2021 | $5,173 | $64,875 | $13,165 | $51,710 |
| 2020 | $5,332 | $64,273 | $12,702 | $51,571 |
| 2019 | $5,164 | $64,273 | $12,702 | $51,571 |
| 2018 | $4,968 | $62,022 | $12,257 | $49,765 |
| 2017 | $4,812 | $59,148 | $11,689 | $47,459 |
| 2016 | $4,870 | $58,926 | $13,257 | $45,669 |
| 2014 | $4,180 | $57,987 | $13,046 | $44,941 |
| 2013 | $4,906 | $59,249 | $13,330 | $45,919 |
Source: Public Records
Map
Nearby Homes
- 222 Alamosa Dr
- 304 Torrington Ln
- 227 Alamosa Dr
- 359 Sleeping Indian Dr
- 363 Sleeping Indian Dr
- 421 Foxtail Dr
- 420 Foxtail Dr
- 433 Foxtail Dr
- 440 Foxtail Dr
- 302 N Railroad St
- 312 W Phillips St
- 206 N Main St
- TBB Kraft Rd
- 207 N Edison St
- 401 N Edison St
- 5433 Kraft Rd
- 520 N Edison St
- 106 S Vine St
- 3 Park St
- 103 Draco Dr
- 308 Silverthorne Dr
- 300 Silverthorne Dr
- 305 Torrington Ln
- 309 Torrington Ln
- 301 Torrington Ln
- 305 Silverthorne Dr
- 301 Silverthorne Dr
- 309 Silverthorne Dr
- 204 Silverthorne Dr
- 313 Torrington Ln
- 207 Silverthorne Dr
- 316 Silverthorne Dr
- 313 Silverthorne Dr
- 205 Silverthorne Dr Unit 207
- 300 Torrington Ln
- 214 Alamosa Dr
- 216 Alamosa Dr
- 210 Alamosa Dr
- 317 Torrington Ln
- 218 Alamosa Dr