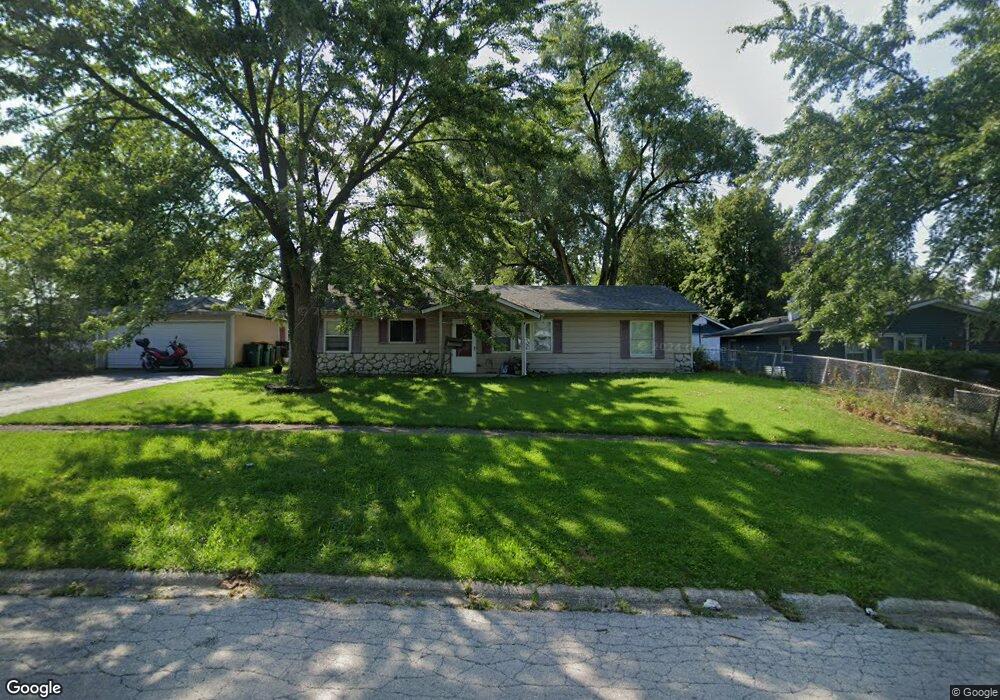
304 Stuart Rd Lockport, IL 60441
Estimated Value: $232,219 - $282,000
Studio
--
Bath
1,200
Sq Ft
$219/Sq Ft
Est. Value
About This Home
This home is located at 304 Stuart Rd, Lockport, IL 60441 and is currently estimated at $263,305, approximately $219 per square foot. 304 Stuart Rd is a home located in Will County with nearby schools including Walsh Elementary School, Ludwig Elementary School, and Reed Elementary School.
Ownership History
Date
Name
Owned For
Owner Type
Purchase Details
Closed on
May 24, 2005
Sold by
Capasso Bruce and Capasso Mariella
Bought by
Babb Anthony
Current Estimated Value
Home Financials for this Owner
Home Financials are based on the most recent Mortgage that was taken out on this home.
Original Mortgage
$123,920
Outstanding Balance
$68,506
Interest Rate
6.79%
Mortgage Type
Purchase Money Mortgage
Estimated Equity
$194,799
Purchase Details
Closed on
Jan 23, 2002
Sold by
Bank One Na
Bought by
Capasso Bruce
Home Financials for this Owner
Home Financials are based on the most recent Mortgage that was taken out on this home.
Original Mortgage
$72,000
Interest Rate
7.23%
Purchase Details
Closed on
Dec 1, 2001
Sold by
Leithliter Robert G and Leithliter Emma M
Bought by
Bank One Na and Residential Funding Corp
Home Financials for this Owner
Home Financials are based on the most recent Mortgage that was taken out on this home.
Original Mortgage
$72,000
Interest Rate
7.23%
Create a Home Valuation Report for This Property
The Home Valuation Report is an in-depth analysis detailing your home's value as well as a comparison with similar homes in the area
Home Values in the Area
Average Home Value in this Area
Purchase History
| Date | Buyer | Sale Price | Title Company |
|---|---|---|---|
| Babb Anthony | $155,000 | Ticor Title | |
| Capasso Bruce | $90,000 | -- | |
| Bank One Na | -- | -- |
Source: Public Records
Mortgage History
| Date | Status | Borrower | Loan Amount |
|---|---|---|---|
| Open | Babb Anthony | $123,920 | |
| Previous Owner | Capasso Bruce | $72,000 |
Source: Public Records
Tax History
| Year | Tax Paid | Tax Assessment Tax Assessment Total Assessment is a certain percentage of the fair market value that is determined by local assessors to be the total taxable value of land and additions on the property. | Land | Improvement |
|---|---|---|---|---|
| 2024 | $5,149 | $74,952 | $22,004 | $52,948 |
| 2023 | $5,149 | $67,288 | $19,754 | $47,534 |
| 2022 | $4,443 | $60,881 | $18,426 | $42,455 |
| 2021 | $4,156 | $57,214 | $17,316 | $39,898 |
| 2020 | $4,040 | $55,333 | $16,747 | $38,586 |
| 2019 | $3,794 | $52,448 | $15,874 | $36,574 |
| 2018 | $3,235 | $44,797 | $14,969 | $29,828 |
| 2017 | $3,066 | $42,289 | $14,131 | $28,158 |
| 2016 | $2,885 | $39,634 | $13,244 | $26,390 |
| 2015 | $2,338 | $34,917 | $11,668 | $23,249 |
| 2014 | $2,338 | $32,331 | $10,804 | $21,527 |
| 2013 | $2,338 | $32,990 | $11,024 | $21,966 |
Source: Public Records
Map
Nearby Homes
- 310 Mccameron Ave
- 936 Treeline Ct Unit 5B
- 1330 Lacoma Ct
- 1041 Ashley Ct S Unit 2D
- 514 N Lockwood Dr
- 805 Maryknoll Dr
- 417 Thornton St
- 9.5 Acres S Archer Ave
- 0 151st & MacGregor St Unit MRD11873272
- 0 Smith Rd South of 135th St Unit MRD12274096
- 0 N State St Unit 10995892
- 118 N State St
- 15303 S Oak Run Ct
- 120 N State St
- 16665 W Merc Ln
- 107 S State St
- 1222 Will Dr
- 519 S Washington St
- 1015 Grandview Ave
- 501 S Hamilton St
- 304 Stuart Rd Unit B
- 304 Stuart Rd Unit A
- 304 Stuart Rd Unit C
- 304 Stuart Rd Unit D
- 304 Stuart Rd Unit E
- 207 Macgregor Rd Unit 1
- 209 Macgregor Rd
- 205 Macgregor Rd
- 306 Stuart Rd
- 304B Stuart Ct
- 301 Macgregor Rd
- 203 Macgregor Rd
- 308 Stuart Rd
- 1020 Highland Ave
- 303 Macgregor Rd
- 1018 Highland Ave
- 310 Stuart Rd
- 1016 Highland Ave
- 201 Macgregor Rd
- 305 Macgregor Rd
Your Personal Tour Guide
Ask me questions while you tour the home.