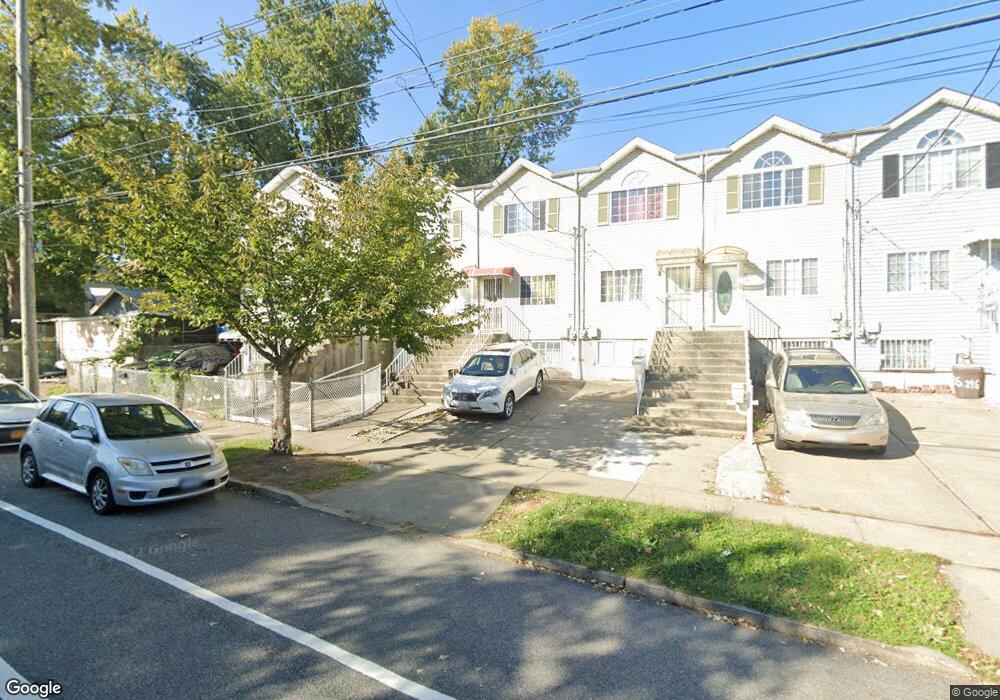
304 Targee St Staten Island, NY 10304
Stapleton NeighborhoodEstimated Value: $509,000 - $571,000
3
Beds
2
Baths
6,075
Sq Ft
$89/Sq Ft
Est. Value
About This Home
This home is located at 304 Targee St, Staten Island, NY 10304 and is currently estimated at $538,057, approximately $88 per square foot. 304 Targee St is a home located in Richmond County with nearby schools including P.S. 78, P.S./I.S. 78Q Early Childhood Center, and I.S. 49 Berta A Dreyfus.
Ownership History
Date
Name
Owned For
Owner Type
Purchase Details
Closed on
Jul 12, 2002
Sold by
Ricca Joseph
Bought by
Lam Kenneth C and Lam Miu Luen
Current Estimated Value
Home Financials for this Owner
Home Financials are based on the most recent Mortgage that was taken out on this home.
Original Mortgage
$132,300
Interest Rate
6.39%
Mortgage Type
Purchase Money Mortgage
Create a Home Valuation Report for This Property
The Home Valuation Report is an in-depth analysis detailing your home's value as well as a comparison with similar homes in the area
Home Values in the Area
Average Home Value in this Area
Purchase History
| Date | Buyer | Sale Price | Title Company |
|---|---|---|---|
| Lam Kenneth C | $191,646 | First American Title Ins Co |
Source: Public Records
Mortgage History
| Date | Status | Borrower | Loan Amount |
|---|---|---|---|
| Previous Owner | Lam Kenneth C | $132,300 |
Source: Public Records
Tax History Compared to Growth
Tax History
| Year | Tax Paid | Tax Assessment Tax Assessment Total Assessment is a certain percentage of the fair market value that is determined by local assessors to be the total taxable value of land and additions on the property. | Land | Improvement |
|---|---|---|---|---|
| 2025 | $1,311 | $31,380 | $2,389 | $28,991 |
| 2024 | $1,415 | $28,080 | $2,647 | $25,433 |
| 2023 | $1,214 | $19,690 | $2,294 | $17,396 |
| 2022 | $1,477 | $26,520 | $3,600 | $22,920 |
| 2021 | $1,632 | $25,620 | $3,600 | $22,020 |
| 2020 | $1,540 | $22,440 | $3,600 | $18,840 |
| 2019 | $1,507 | $22,980 | $3,600 | $19,380 |
| 2018 | $3,047 | $16,408 | $2,913 | $13,495 |
| 2017 | $2,856 | $15,480 | $3,600 | $11,880 |
| 2016 | $2,754 | $15,327 | $3,497 | $11,830 |
| 2015 | $2,447 | $14,460 | $3,000 | $11,460 |
| 2014 | $2,447 | $14,340 | $3,000 | $11,340 |
Source: Public Records
Map
Nearby Homes