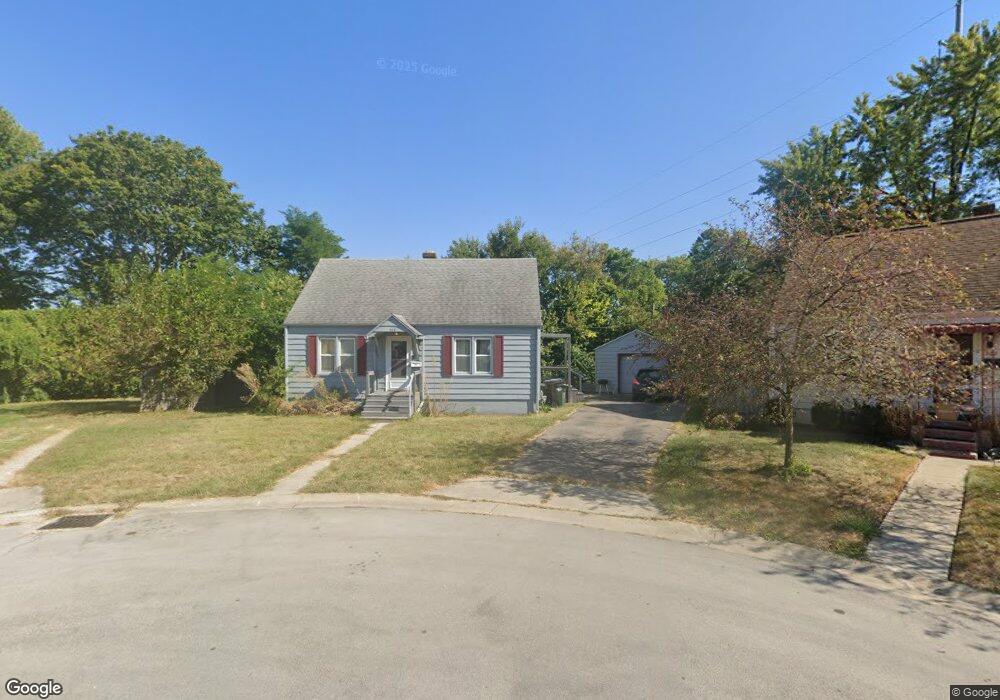
304 Tate Ave Englewood, OH 45322
Estimated Value: $188,721 - $197,000
3
Beds
2
Baths
1,411
Sq Ft
$137/Sq Ft
Est. Value
About This Home
This home is located at 304 Tate Ave, Englewood, OH 45322 and is currently estimated at $192,680, approximately $136 per square foot. 304 Tate Ave is a home located in Montgomery County with nearby schools including Northmont High School, Imagine Schools - Woodbury Academy, and Salem Christian Academy.
Ownership History
Date
Name
Owned For
Owner Type
Purchase Details
Closed on
Oct 29, 2024
Sold by
Meagley Karry L and Reigh Karry L
Bought by
Reigh Daniel
Current Estimated Value
Purchase Details
Closed on
Apr 16, 2018
Sold by
Marker Robert E
Bought by
Reigh Daniel and Reigh Karry L
Home Financials for this Owner
Home Financials are based on the most recent Mortgage that was taken out on this home.
Original Mortgage
$101,134
Interest Rate
5.37%
Mortgage Type
FHA
Purchase Details
Closed on
Jun 3, 2014
Sold by
Marker Robert E and Marker Mary K
Bought by
Marker Robert E and Marker Mary K
Purchase Details
Closed on
Jun 17, 2005
Sold by
Marker Robert E and Marker Mary K
Bought by
Marker Robert E and Marker Mary K
Create a Home Valuation Report for This Property
The Home Valuation Report is an in-depth analysis detailing your home's value as well as a comparison with similar homes in the area
Home Values in the Area
Average Home Value in this Area
Purchase History
| Date | Buyer | Sale Price | Title Company |
|---|---|---|---|
| Reigh Daniel | -- | None Listed On Document | |
| Reigh Daniel | -- | None Listed On Document | |
| Reigh Daniel | $103,000 | Performance Title Inc | |
| Marker Robert E | -- | None Available | |
| Marker Robert E | -- | -- |
Source: Public Records
Mortgage History
| Date | Status | Borrower | Loan Amount |
|---|---|---|---|
| Previous Owner | Reigh Daniel | $101,134 |
Source: Public Records
Tax History Compared to Growth
Tax History
| Year | Tax Paid | Tax Assessment Tax Assessment Total Assessment is a certain percentage of the fair market value that is determined by local assessors to be the total taxable value of land and additions on the property. | Land | Improvement |
|---|---|---|---|---|
| 2024 | $2,971 | $50,840 | $13,120 | $37,720 |
| 2023 | $2,971 | $50,840 | $13,120 | $37,720 |
| 2022 | $2,716 | $35,760 | $9,240 | $26,520 |
| 2021 | $2,661 | $35,760 | $9,240 | $26,520 |
| 2020 | $2,630 | $35,760 | $9,240 | $26,520 |
| 2019 | $2,496 | $30,370 | $10,630 | $19,740 |
| 2018 | $1,757 | $30,370 | $10,630 | $19,740 |
| 2017 | $1,725 | $30,370 | $10,630 | $19,740 |
| 2016 | $1,662 | $29,210 | $9,240 | $19,970 |
| 2015 | $1,520 | $29,210 | $9,240 | $19,970 |
| 2014 | $1,520 | $29,210 | $9,240 | $19,970 |
| 2012 | -- | $32,590 | $9,240 | $23,350 |
Source: Public Records
Map
Nearby Homes