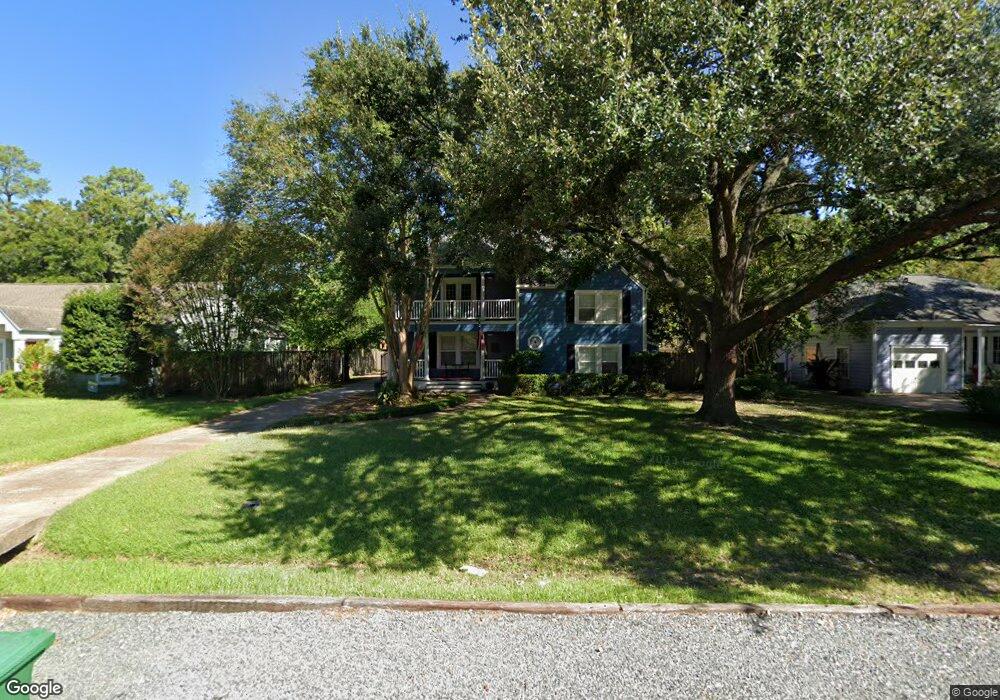
304 W 33rd St Houston, TX 77018
Oak Forest-Garden Oaks NeighborhoodEstimated Value: $975,000 - $1,156,264
6
Beds
5
Baths
4,437
Sq Ft
$242/Sq Ft
Est. Value
About This Home
This home is located at 304 W 33rd St, Houston, TX 77018 and is currently estimated at $1,074,816, approximately $242 per square foot. 304 W 33rd St is a home located in Harris County with nearby schools including Garden Oaks Montessori, Frank Black Middle School, and Booker T Washington Sr High.
Ownership History
Date
Name
Owned For
Owner Type
Purchase Details
Closed on
Jun 30, 2008
Sold by
Wood Ronald A and Wood Natalie A
Bought by
Jones Michael P and Jones Bonnie F
Current Estimated Value
Home Financials for this Owner
Home Financials are based on the most recent Mortgage that was taken out on this home.
Original Mortgage
$326,000
Outstanding Balance
$209,457
Interest Rate
5.99%
Mortgage Type
Purchase Money Mortgage
Estimated Equity
$865,359
Purchase Details
Closed on
Jul 8, 1994
Sold by
Watchtower Bible & Tract Society Of Penn
Bought by
Wood Ronald A and Wood Natalie A
Home Financials for this Owner
Home Financials are based on the most recent Mortgage that was taken out on this home.
Original Mortgage
$139,650
Interest Rate
8.47%
Create a Home Valuation Report for This Property
The Home Valuation Report is an in-depth analysis detailing your home's value as well as a comparison with similar homes in the area
Home Values in the Area
Average Home Value in this Area
Purchase History
| Date | Buyer | Sale Price | Title Company |
|---|---|---|---|
| Jones Michael P | -- | Etc | |
| Wood Ronald A | -- | Fidelity National Title |
Source: Public Records
Mortgage History
| Date | Status | Borrower | Loan Amount |
|---|---|---|---|
| Open | Jones Michael P | $326,000 | |
| Previous Owner | Wood Ronald A | $139,650 |
Source: Public Records
Tax History Compared to Growth
Tax History
| Year | Tax Paid | Tax Assessment Tax Assessment Total Assessment is a certain percentage of the fair market value that is determined by local assessors to be the total taxable value of land and additions on the property. | Land | Improvement |
|---|---|---|---|---|
| 2025 | $15,664 | $1,092,000 | $546,336 | $545,664 |
| 2024 | $15,664 | $985,944 | $546,336 | $439,608 |
| 2023 | $15,664 | $951,056 | $520,320 | $430,736 |
| 2022 | $19,861 | $860,000 | $429,264 | $430,736 |
| 2021 | $19,111 | $820,000 | $403,248 | $416,752 |
| 2020 | $18,847 | $778,300 | $403,248 | $375,052 |
| 2019 | $19,694 | $778,300 | $403,248 | $375,052 |
| 2018 | $15,353 | $769,500 | $364,224 | $405,276 |
| 2017 | $19,782 | $782,334 | $364,224 | $418,110 |
| 2016 | $20,744 | $820,375 | $364,224 | $456,151 |
| 2015 | $12,931 | $693,324 | $364,224 | $329,100 |
| 2014 | $12,931 | $634,191 | $260,160 | $374,031 |
Source: Public Records
Map
Nearby Homes
- 312 W 32nd St
- 207 W 33rd St
- 336 W 32nd St
- 111 E 33rd St Unit B
- 119 E 32nd St Unit A
- 136 E 37th St
- 408 W 30th St
- 131 E 31st 1 2 St
- 121 E 31st 1 2 St Unit Lots 15,16 & 17
- 202 E 37th St
- 824 & 828 W 32nd St
- 3903 Yale Heights Dr
- 1714 Plan B at Tulane Crossing
- 1752 Plan A at Tulane Crossing
- 3907 Tulane St
- 218 E 37th St
- 3902 Zina Way
- 3909 Yale St
- 3908 Zina Way
- 3911 Tulane St