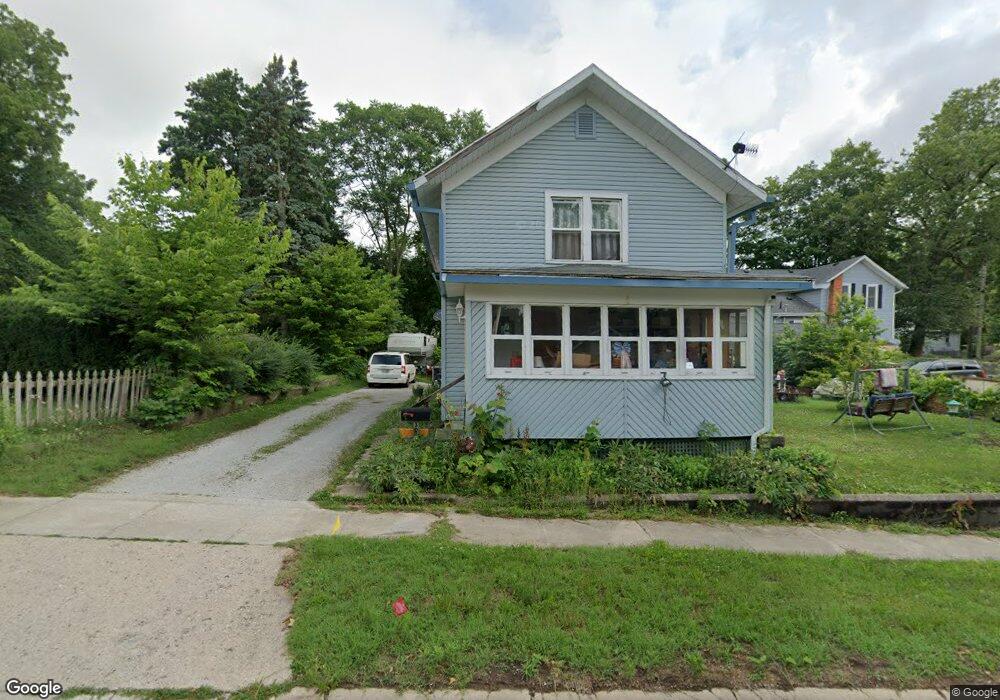
304 W Alexander St Buchanan, MI 49107
Estimated Value: $172,842 - $179,000
2
Beds
1
Bath
1,250
Sq Ft
$140/Sq Ft
Est. Value
About This Home
This home is located at 304 W Alexander St, Buchanan, MI 49107 and is currently estimated at $175,461, approximately $140 per square foot. 304 W Alexander St is a home located in Berrien County with nearby schools including Ottawa Elementary School, Moccasin Elementary School, and Buchanan Middle School.
Ownership History
Date
Name
Owned For
Owner Type
Purchase Details
Closed on
Jul 15, 2020
Sold by
Wilmington Savings Fund Society Fsb
Bought by
Natijonwijde Servicing Center Inc
Current Estimated Value
Purchase Details
Closed on
Feb 1, 2017
Sold by
Sg Capital Partners Llc
Bought by
The Dexter Group Trust and Wilmington Savings Fund Society Fsb
Purchase Details
Closed on
Dec 10, 2015
Sold by
Harbour Portfolio Vii Lp
Bought by
Sg Capital Partners Llc
Purchase Details
Closed on
Dec 13, 2013
Sold by
Harbour Portfolio Viii Lp
Bought by
Hollingsworth Noah A and Hollingsworth Christal
Home Financials for this Owner
Home Financials are based on the most recent Mortgage that was taken out on this home.
Original Mortgage
$30,600
Interest Rate
9.9%
Mortgage Type
Seller Take Back
Purchase Details
Closed on
Jun 24, 2013
Sold by
Fannie Mae
Bought by
Harbour Portfolio Viii Lp
Purchase Details
Closed on
May 23, 2011
Sold by
Bac Home Loans Servicing Lp
Bought by
Fannie Mae
Purchase Details
Closed on
May 5, 2011
Sold by
Sears Joseph G and Sears Rose M
Bought by
Bac Home Loans Servicing Lp
Purchase Details
Closed on
Apr 1, 1975
Create a Home Valuation Report for This Property
The Home Valuation Report is an in-depth analysis detailing your home's value as well as a comparison with similar homes in the area
Home Values in the Area
Average Home Value in this Area
Purchase History
| Date | Buyer | Sale Price | Title Company |
|---|---|---|---|
| Natijonwijde Servicing Center Inc | $23,839 | None Available | |
| The Dexter Group Trust | $21,805 | None Available | |
| Sg Capital Partners Llc | $22,349 | None Available | |
| Hollingsworth Noah A | $31,700 | None Available | |
| Harbour Portfolio Viii Lp | $10,958 | Servicelink | |
| Fannie Mae | -- | None Available | |
| Bac Home Loans Servicing Lp | $30,909 | None Available | |
| -- | $7,000 | -- |
Source: Public Records
Mortgage History
| Date | Status | Borrower | Loan Amount |
|---|---|---|---|
| Previous Owner | Hollingsworth Noah A | $30,600 |
Source: Public Records
Tax History Compared to Growth
Tax History
| Year | Tax Paid | Tax Assessment Tax Assessment Total Assessment is a certain percentage of the fair market value that is determined by local assessors to be the total taxable value of land and additions on the property. | Land | Improvement |
|---|---|---|---|---|
| 2025 | $5,313 | $70,700 | $0 | $0 |
| 2024 | $2,520 | $61,200 | $0 | $0 |
| 2023 | $2,421 | $52,000 | $0 | $0 |
| 2022 | $2,352 | $43,900 | $0 | $0 |
| 2021 | $2,408 | $40,500 | $2,600 | $37,900 |
| 2020 | $1,621 | $40,600 | $0 | $0 |
| 2019 | $1,591 | $39,500 | $2,100 | $37,400 |
| 2018 | $1,648 | $39,500 | $0 | $0 |
| 2017 | $3,279 | $39,300 | $0 | $0 |
| 2016 | $3,018 | $38,900 | $0 | $0 |
| 2015 | $1,507 | $37,200 | $0 | $0 |
| 2014 | $1,360 | $35,400 | $0 | $0 |
Source: Public Records
Map
Nearby Homes
- 103 W Smith St
- 113 W Chicago St
- 501 S Oak St
- 201 S Oak St
- 106 Lake St
- 209 Terre Coupe St
- 404 S Red Bud Trail
- 302 Sylvan St
- 111 W 4th St
- 204 Willow Dr
- 322 N Cayuga St
- 4047 Wildon Ct
- 313 N Red Bud Trail
- 802 Carrol St
- 507 Middleton Ct
- 747 Chippewa St
- 118 Schirmer Pkwy
- 317 Elizabeth St
- 426 Elizabeth St
- Track 4 W Us 12 Hwy Trail
- 306 Clark St
- 306 W Alexander St
- 308 W Alexander St
- 305 W Chicago St
- 307 W Chicago St
- 303 W Alexander St
- 305 W Alexander St
- 307 W Alexander St
- 302 Clark St
- 128 W Alexander St
- 307 Phelps St
- 305 Phelps St
- 309 W Chicago St
- 127 W Alexander St
- 301 Clark St
- 401 Phelps St
- 303 Phelps St
- 208 Clark St
- 308 W Smith St
- 408 Clark St