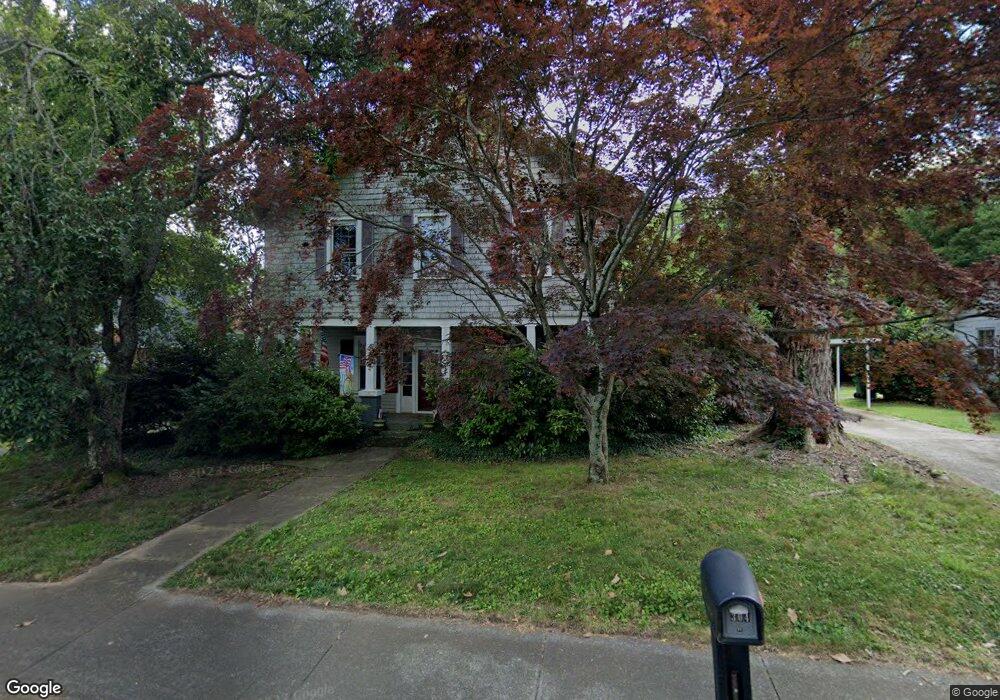
304 W Main St Unit STW Pilot Mountain, NC 27041
Estimated Value: $271,420 - $367,000
4
Beds
2
Baths
2,956
Sq Ft
$115/Sq Ft
Est. Value
About This Home
This home is located at 304 W Main St Unit STW, Pilot Mountain, NC 27041 and is currently estimated at $339,855, approximately $114 per square foot. 304 W Main St Unit STW is a home located in Surry County with nearby schools including Pilot Mountain Elementary School, Pilot Mountain Middle School, and East Surry High School.
Ownership History
Date
Name
Owned For
Owner Type
Purchase Details
Closed on
Nov 19, 2007
Sold by
Needham Tyre C and Needham Elizabeth C
Bought by
Collins Stephen L and Collins Rachel Gilley
Current Estimated Value
Home Financials for this Owner
Home Financials are based on the most recent Mortgage that was taken out on this home.
Original Mortgage
$37,800
Outstanding Balance
$6,510
Interest Rate
6.36%
Mortgage Type
Unknown
Estimated Equity
$333,345
Purchase Details
Closed on
Aug 24, 2005
Sold by
Slate Dusty L and Slate Leigh Anne
Bought by
Needham Tyre C and Needham Elizabeth C
Home Financials for this Owner
Home Financials are based on the most recent Mortgage that was taken out on this home.
Original Mortgage
$180,000
Interest Rate
5.61%
Mortgage Type
New Conventional
Purchase Details
Closed on
Jun 1, 1998
Purchase Details
Closed on
Feb 1, 1957
Create a Home Valuation Report for This Property
The Home Valuation Report is an in-depth analysis detailing your home's value as well as a comparison with similar homes in the area
Home Values in the Area
Average Home Value in this Area
Purchase History
| Date | Buyer | Sale Price | Title Company |
|---|---|---|---|
| Collins Stephen L | $189,000 | None Available | |
| Needham Tyre C | $180,000 | Chicago Title Insurence Comp | |
| -- | $91,000 | -- | |
| -- | -- | -- |
Source: Public Records
Mortgage History
| Date | Status | Borrower | Loan Amount |
|---|---|---|---|
| Open | Collins Stephen L | $37,800 | |
| Open | Collins Stephen L | $151,200 | |
| Previous Owner | Needham Tyre C | $180,000 |
Source: Public Records
Tax History Compared to Growth
Tax History
| Year | Tax Paid | Tax Assessment Tax Assessment Total Assessment is a certain percentage of the fair market value that is determined by local assessors to be the total taxable value of land and additions on the property. | Land | Improvement |
|---|---|---|---|---|
| 2025 | $2,524 | $221,240 | $20,800 | $200,440 |
| 2024 | $2,200 | $185,540 | $20,800 | $164,740 |
| 2023 | $2,159 | $185,540 | $20,800 | $164,740 |
| 2022 | $2,159 | $185,540 | $20,800 | $164,740 |
| 2021 | $2,200 | $185,540 | $20,800 | $164,740 |
| 2020 | $2,228 | $183,110 | $20,800 | $162,310 |
| 2019 | $2,225 | $183,110 | $20,800 | $162,310 |
| 2018 | $2,182 | $183,110 | $0 | $0 |
| 2017 | $2,222 | $183,110 | $0 | $0 |
| 2016 | $2,222 | $183,110 | $0 | $0 |
| 2013 | -- | $183,110 | $0 | $0 |
Source: Public Records
Map
Nearby Homes
- 205 S Key St
- o N Carolina 268
- 502 S Key St
- 267 S Boyles St
- 273 S Boyles St
- 225 E Main St
- 710 Saddle Dr
- 204 Nelson St
- TBD S Key St
- 528 E Main St
- 0 Heatherly Creek Dr
- 205 Crestwood Dr
- 950 Dodson Mill Rd
- 0 S Key St
- 624 E 52 Bypass
- 00 Golf Course Rd
- TBD Golf Course Rd
- 00 Whitaker Chapel Rd Unit 2
- 00 Whitaker Chapel Rd Unit 1
- 00 Whitaker Chapel Rd Unit 10
- 300 W Main St Unit STW
- 308 W Main St Unit STW
- 109 S Key St
- 303 W Main St Unit STW
- 307 W Main St
- 307 W Main St
- 307 W Main St Unit STW
- 301 W Main St
- 312 W Main St Unit STW
- 00 Butler St
- 317 W Marion St
- 0710 Southwick Ln
- 107 N Key St
- 107 Key St
- 201 S Key St
- 312 S Marion
- 229 W Main St
- 106 N Key St
- 312 W Marion St Unit STW
- 109 N Key St