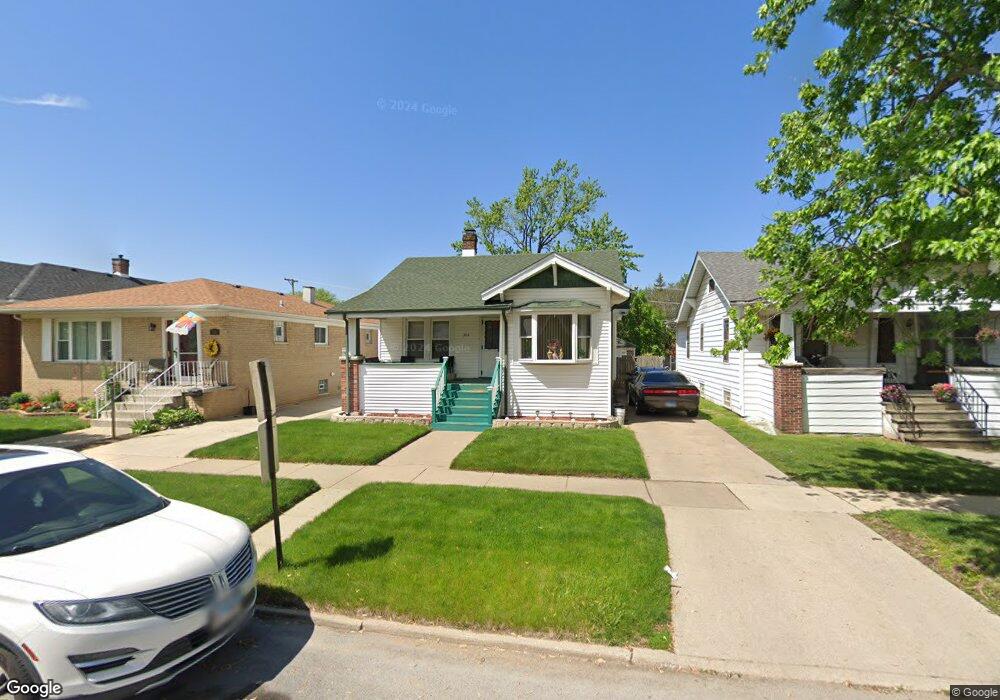
304 Warren St Calumet City, IL 60409
Estimated Value: $148,000 - $214,000
3
Beds
2
Baths
1,100
Sq Ft
$154/Sq Ft
Est. Value
About This Home
This home is located at 304 Warren St, Calumet City, IL 60409 and is currently estimated at $169,694, approximately $154 per square foot. 304 Warren St is a home located in Cook County with nearby schools including Lincoln Elementary School, Thornton Fractional North High School, and Hammond Academy Of Science & Tech.
Ownership History
Date
Name
Owned For
Owner Type
Purchase Details
Closed on
Oct 9, 2009
Sold by
Jeka Clevonne
Bought by
Jackson Sherease M
Current Estimated Value
Home Financials for this Owner
Home Financials are based on the most recent Mortgage that was taken out on this home.
Original Mortgage
$70,597
Outstanding Balance
$45,673
Interest Rate
4.9%
Mortgage Type
FHA
Estimated Equity
$124,021
Purchase Details
Closed on
May 27, 2004
Sold by
Mb Financial Bank Na
Bought by
The Ieka Joint Trust
Create a Home Valuation Report for This Property
The Home Valuation Report is an in-depth analysis detailing your home's value as well as a comparison with similar homes in the area
Home Values in the Area
Average Home Value in this Area
Purchase History
| Date | Buyer | Sale Price | Title Company |
|---|---|---|---|
| Jackson Sherease M | $72,000 | Git | |
| The Ieka Joint Trust | -- | -- |
Source: Public Records
Mortgage History
| Date | Status | Borrower | Loan Amount |
|---|---|---|---|
| Open | Jackson Sherease M | $70,597 |
Source: Public Records
Tax History Compared to Growth
Tax History
| Year | Tax Paid | Tax Assessment Tax Assessment Total Assessment is a certain percentage of the fair market value that is determined by local assessors to be the total taxable value of land and additions on the property. | Land | Improvement |
|---|---|---|---|---|
| 2024 | $2,314 | $7,500 | $1,872 | $5,628 |
| 2023 | $2,194 | $7,500 | $1,872 | $5,628 |
| 2022 | $2,194 | $6,451 | $1,638 | $4,813 |
| 2021 | $2,305 | $6,450 | $1,638 | $4,812 |
| 2020 | $2,306 | $6,450 | $1,638 | $4,812 |
| 2019 | $2,486 | $6,868 | $1,521 | $5,347 |
| 2018 | $2,446 | $6,868 | $1,521 | $5,347 |
| 2017 | $2,398 | $6,868 | $1,521 | $5,347 |
| 2016 | $2,620 | $6,549 | $1,404 | $5,145 |
| 2015 | $2,450 | $6,549 | $1,404 | $5,145 |
| 2014 | $2,482 | $6,549 | $1,404 | $5,145 |
| 2013 | $4,340 | $7,662 | $1,404 | $6,258 |
Source: Public Records
Map
Nearby Homes