Estimated Value: $508,000 - $553,555
4
Beds
3
Baths
3,342
Sq Ft
$157/Sq Ft
Est. Value
About This Home
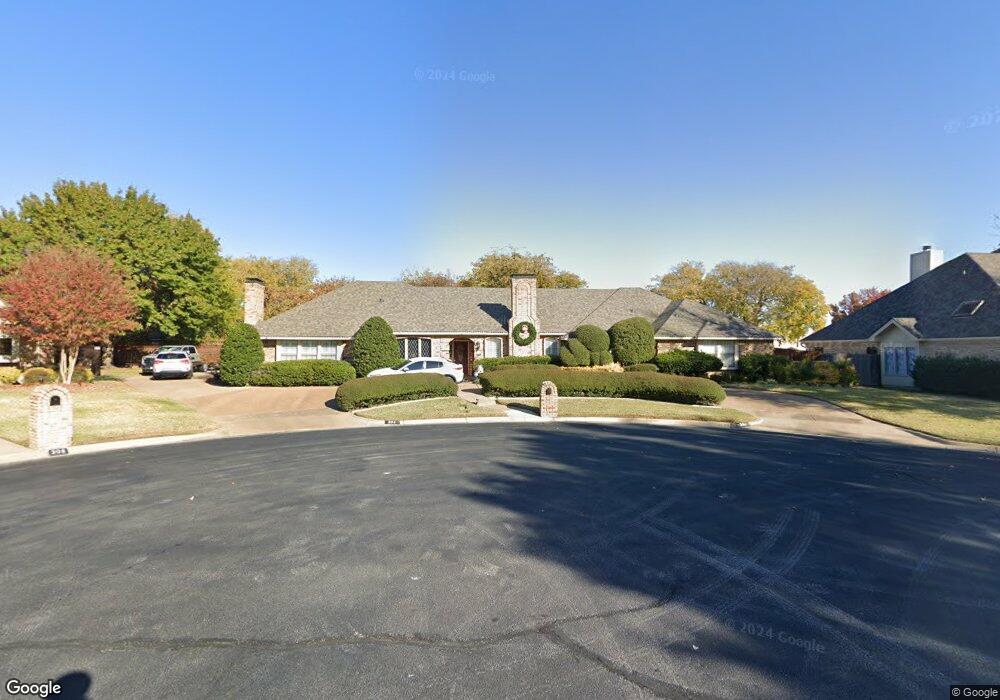
This home is located at 304 Wingate Ct, Hurst, TX 76054 and is currently estimated at $525,639, approximately $157 per square foot. 304 Wingate Ct is a home located in Tarrant County with nearby schools including Shady Oaks Elementary School, Bedford Junior High School, and L.D. Bell High School.
Ownership History
Date
Name
Owned For
Owner Type
Purchase Details
Closed on
Feb 23, 2023
Sold by
Larry C Hyden C and Larry Sandra E
Bought by
Howard Johnny W and Howard Patricia Carlene
Current Estimated Value
Purchase Details
Closed on
Dec 13, 2017
Sold by
Hyden Larry C and Hyden Sandra E
Bought by
Hyden Larry C and Hyden Sandra E
Purchase Details
Closed on
Nov 5, 2009
Sold by
Caldwell Richard K and Caldwell Lark F
Bought by
Hyden Larry C and Hyden Sandra E
Home Financials for this Owner
Home Financials are based on the most recent Mortgage that was taken out on this home.
Original Mortgage
$220,000
Interest Rate
5.03%
Mortgage Type
New Conventional
Purchase Details
Closed on
Jul 31, 2001
Sold by
Carroll Jerry G and Carrol Norma J
Bought by
Caldwell Richard K and Caldwell Lark F
Home Financials for this Owner
Home Financials are based on the most recent Mortgage that was taken out on this home.
Original Mortgage
$185,000
Interest Rate
7.07%
Create a Home Valuation Report for This Property
The Home Valuation Report is an in-depth analysis detailing your home's value as well as a comparison with similar homes in the area
Home Values in the Area
Average Home Value in this Area
Purchase History
| Date | Buyer | Sale Price | Title Company |
|---|---|---|---|
| Howard Johnny W | -- | Rattikin Title | |
| Hyden Larry C | -- | None Available | |
| Hyden Larry C | -- | Providence Title Company | |
| Caldwell Richard K | -- | Metroplex Title Inc |
Source: Public Records
Mortgage History
| Date | Status | Borrower | Loan Amount |
|---|---|---|---|
| Previous Owner | Hyden Larry C | $220,000 | |
| Previous Owner | Caldwell Richard K | $185,000 |
Source: Public Records
Tax History
| Year | Tax Paid | Tax Assessment Tax Assessment Total Assessment is a certain percentage of the fair market value that is determined by local assessors to be the total taxable value of land and additions on the property. | Land | Improvement |
|---|---|---|---|---|
| 2025 | $6,247 | $425,000 | $80,000 | $345,000 |
| 2024 | $6,247 | $425,000 | $80,000 | $345,000 |
| 2023 | $9,608 | $479,571 | $55,000 | $424,571 |
| 2022 | $10,463 | $454,424 | $55,000 | $399,424 |
| 2021 | $10,012 | $415,151 | $55,000 | $360,151 |
| 2020 | $9,369 | $389,425 | $55,000 | $334,425 |
| 2019 | $9,031 | $400,880 | $55,000 | $345,880 |
| 2018 | $8,807 | $359,839 | $55,000 | $304,839 |
| 2017 | $7,717 | $323,741 | $40,000 | $283,741 |
| 2016 | $7,015 | $277,228 | $40,000 | $237,228 |
| 2015 | $1,930 | $265,200 | $20,100 | $245,100 |
| 2014 | $1,930 | $265,200 | $20,100 | $245,100 |
Source: Public Records
Map
Nearby Homes
- 440 W Louella Dr
- 201 W Louella Dr
- 404 Mountainview Dr
- 413 Baker Dr
- 409 Circleview Dr N
- 200 Hillview Dr
- 421 Cavender Ct
- 201 Hillview Dr
- 129 E Louella Dr
- 137 E Louella Dr
- 412 Elisha Dr
- 2021 Mountainview Dr
- 417 Sunnybrook Ct
- 600 Circleview Dr N
- 317 Northglen Dr
- 1760 Acorn Ln
- 1761 Cynthia Ln
- 612 Circleview Dr S
- 3002 Carolyn Ct
- 3006 Carolyn Ct
- 305 Westover Ct
- 300 Wingate Ct
- 301 Westover Ct
- 308 Wingate Ct
- 309 Westover Ct
- 309 Wingate Ct
- 305 Wingate Ct
- 301 Wingate Ct
- 300 Westover Ct
- 325 Charleston Place
- 313 Westover Ct
- 321 Charleston Place
- 308 Mayfair Dr
- 304 Mayfair Dr
- 312 Mayfair Dr
- 317 Charleston Place
- 300 Mayfair Dr
- 329 Charleston Place
- 316 Mayfair Dr
- 312 Westover Ct
Your Personal Tour Guide
Ask me questions while you tour the home.