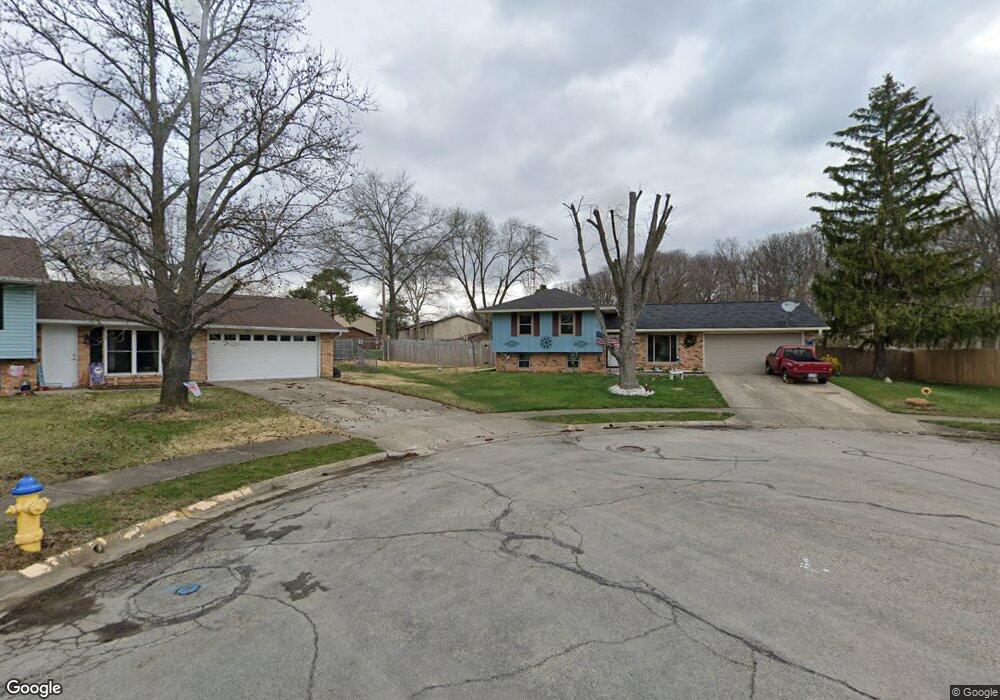
3040 Lynnhaven St Springfield, OH 45503
Estimated Value: $180,000 - $209,000
3
Beds
2
Baths
908
Sq Ft
$215/Sq Ft
Est. Value
About This Home
This home is located at 3040 Lynnhaven St, Springfield, OH 45503 and is currently estimated at $195,643, approximately $215 per square foot. 3040 Lynnhaven St is a home located in Clark County with nearby schools including Kenton Elementary School, Roosevelt Middle School, and Springfield High School.
Ownership History
Date
Name
Owned For
Owner Type
Purchase Details
Closed on
Jul 16, 2020
Sold by
Zimmer Delia A and Zimmer Timothy E
Bought by
Zimmer Delia A and Zimmer Timothy E
Current Estimated Value
Home Financials for this Owner
Home Financials are based on the most recent Mortgage that was taken out on this home.
Original Mortgage
$50,000
Outstanding Balance
$35,405
Interest Rate
3.2%
Mortgage Type
New Conventional
Estimated Equity
$160,238
Purchase Details
Closed on
Mar 30, 2018
Sold by
Gribler Philip L
Bought by
Zimmer Delia A
Purchase Details
Closed on
Jun 23, 1995
Sold by
Crum Daren J
Bought by
Gribler Philip L and Gribler Delia
Home Financials for this Owner
Home Financials are based on the most recent Mortgage that was taken out on this home.
Original Mortgage
$81,000
Interest Rate
7.9%
Mortgage Type
VA
Purchase Details
Closed on
Feb 3, 1992
Create a Home Valuation Report for This Property
The Home Valuation Report is an in-depth analysis detailing your home's value as well as a comparison with similar homes in the area
Home Values in the Area
Average Home Value in this Area
Purchase History
| Date | Buyer | Sale Price | Title Company |
|---|---|---|---|
| Zimmer Delia A | -- | None Available | |
| Zimmer Delia A | -- | None Available | |
| Gribler Philip L | $79,450 | -- | |
| -- | $69,400 | -- |
Source: Public Records
Mortgage History
| Date | Status | Borrower | Loan Amount |
|---|---|---|---|
| Open | Zimmer Delia A | $50,000 | |
| Previous Owner | Gribler Philip L | $81,000 |
Source: Public Records
Tax History Compared to Growth
Tax History
| Year | Tax Paid | Tax Assessment Tax Assessment Total Assessment is a certain percentage of the fair market value that is determined by local assessors to be the total taxable value of land and additions on the property. | Land | Improvement |
|---|---|---|---|---|
| 2024 | $2,148 | $44,570 | $9,100 | $35,470 |
| 2023 | $2,148 | $44,570 | $9,100 | $35,470 |
| 2022 | $2,200 | $44,570 | $9,100 | $35,470 |
| 2021 | $1,949 | $36,460 | $6,840 | $29,620 |
| 2020 | $1,954 | $36,460 | $6,840 | $29,620 |
| 2019 | $1,959 | $36,460 | $6,840 | $29,620 |
| 2018 | $1,787 | $31,960 | $7,250 | $24,710 |
| 2017 | $1,786 | $33,996 | $7,252 | $26,744 |
| 2016 | $1,789 | $33,996 | $7,252 | $26,744 |
| 2015 | $1,857 | $33,587 | $6,843 | $26,744 |
| 2014 | $1,849 | $33,587 | $6,843 | $26,744 |
| 2013 | $1,829 | $33,587 | $6,843 | $26,744 |
Source: Public Records
Map
Nearby Homes
- 1506 Hyannis Dr
- 3129 Haverhill St
- 1225 Vester Ave
- 1732 Falmouth Ave
- 2907 Mystic Ln
- 1939 Providence Ave
- 2933 Bahia Dr
- 3032 Armsgate Rd Unit 25
- 3307 Tackett St
- 2683 Home Orchard Dr
- 3214 Revels St
- 1811 Devon Dr
- 2541 Derr Rd
- 3231 Vineyard St
- 2933 Stonehaven Dr
- 3046 Brixton Dr W Unit 173
- 2022 Westboro Ave
- 647 Villa Rd Unit A
- 1148 Foxboro Rd
- 2524 Home Orchard Dr
- 3039 Lynnhaven St
- 3039 Ipswich St
- 3037 Ipswich St
- 3037 Lynnhaven St
- 3036 Lynnhaven St
- 3041 Ipswich St
- 3035 Ipswich St
- 3035 Lynnhaven St
- 3040 New Haven St
- 3038 New Haven St
- 3036 New Haven St
- 3038 Ipswich St
- 1525 Providence Ave
- 1521 Providence Ave
- 3036 Ipswich St
- 3041 New Haven St
- 1535 Providence Ave
- 1513 Providence Ave
- 1505 Providence Ave
- 1601 Providence Ave