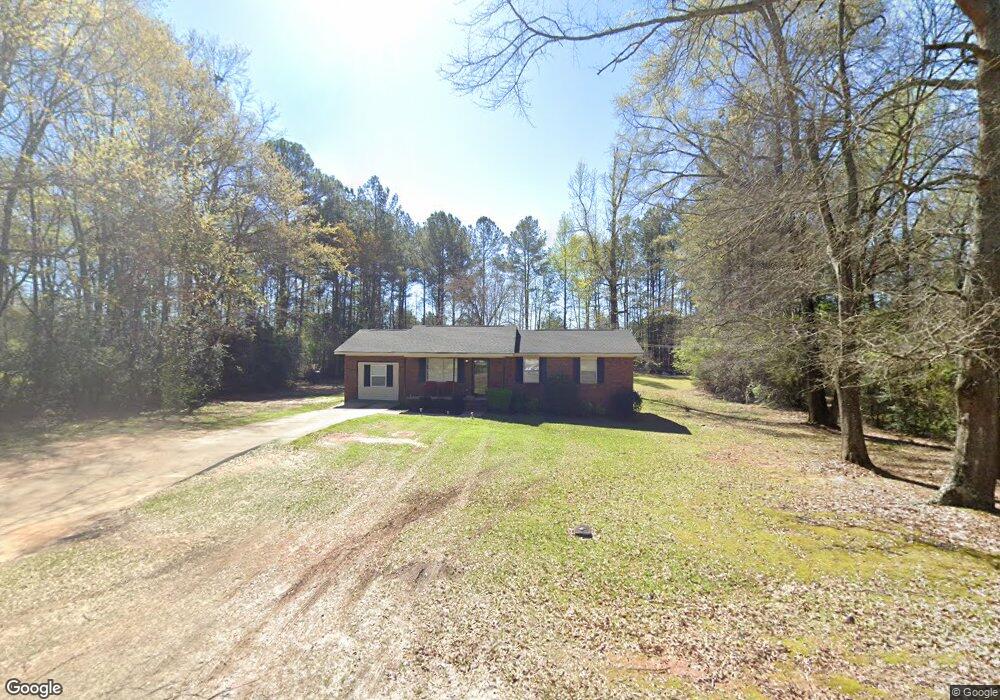
3040 Mobley Bridge Rd Hogansville, GA 30230
Estimated Value: $149,000 - $187,000
3
Beds
1
Bath
1,275
Sq Ft
$134/Sq Ft
Est. Value
About This Home
This home is located at 3040 Mobley Bridge Rd, Hogansville, GA 30230 and is currently estimated at $170,257, approximately $133 per square foot. 3040 Mobley Bridge Rd is a home located in Troup County with nearby schools including Hogansville Elementary School, Callaway Elementary School, and Callaway Middle School.
Ownership History
Date
Name
Owned For
Owner Type
Purchase Details
Closed on
Apr 13, 2006
Sold by
Jack P Brown
Bought by
Terrell Marciano L
Current Estimated Value
Home Financials for this Owner
Home Financials are based on the most recent Mortgage that was taken out on this home.
Original Mortgage
$83,686
Outstanding Balance
$47,953
Interest Rate
6.31%
Mortgage Type
FHA
Estimated Equity
$122,304
Purchase Details
Closed on
Dec 7, 2005
Sold by
United State Of America
Bought by
Jack P Brown
Purchase Details
Closed on
Jul 11, 1990
Sold by
Tyson Co Inc
Bought by
Betty Henry and Betty Hudson
Purchase Details
Closed on
Jan 1, 1989
Sold by
Bobby L Clark
Bought by
Tyson Co Inc
Purchase Details
Closed on
Apr 1, 1986
Sold by
Cynthia W Kunzer
Bought by
Bobby L Clark
Purchase Details
Closed on
Oct 1, 1984
Sold by
Wilkinson Inc
Bought by
Cynthia W Kunzer
Purchase Details
Closed on
Feb 10, 1982
Sold by
John Wilkinson
Bought by
Wilkinson Inc
Purchase Details
Closed on
Nov 1, 1981
Sold by
C&S Nat Bank Trustee
Bought by
John Wilkinson
Create a Home Valuation Report for This Property
The Home Valuation Report is an in-depth analysis detailing your home's value as well as a comparison with similar homes in the area
Home Values in the Area
Average Home Value in this Area
Purchase History
| Date | Buyer | Sale Price | Title Company |
|---|---|---|---|
| Terrell Marciano L | $85,000 | -- | |
| Jack P Brown | $44,452 | -- | |
| Betty Henry | $49,900 | -- | |
| Tyson Co Inc | -- | -- | |
| Bobby L Clark | -- | -- | |
| Cynthia W Kunzer | -- | -- | |
| Wilkinson Inc | -- | -- | |
| John Wilkinson | -- | -- |
Source: Public Records
Mortgage History
| Date | Status | Borrower | Loan Amount |
|---|---|---|---|
| Open | Terrell Marciano L | $83,686 |
Source: Public Records
Tax History Compared to Growth
Tax History
| Year | Tax Paid | Tax Assessment Tax Assessment Total Assessment is a certain percentage of the fair market value that is determined by local assessors to be the total taxable value of land and additions on the property. | Land | Improvement |
|---|---|---|---|---|
| 2024 | $1,367 | $38,808 | $3,600 | $35,208 |
| 2023 | $1,235 | $35,056 | $3,600 | $31,456 |
| 2022 | $1,165 | $32,496 | $3,600 | $28,896 |
| 2021 | $925 | $24,264 | $3,600 | $20,664 |
| 2020 | $925 | $24,264 | $3,600 | $20,664 |
| 2019 | $911 | $23,916 | $3,600 | $20,316 |
| 2018 | $841 | $22,060 | $3,600 | $18,460 |
| 2017 | $841 | $22,060 | $3,600 | $18,460 |
| 2016 | $817 | $21,429 | $3,600 | $17,829 |
| 2015 | $818 | $21,429 | $3,600 | $17,829 |
| 2014 | $783 | $20,491 | $3,600 | $16,891 |
| 2013 | -- | $21,610 | $3,600 | $18,010 |
Source: Public Records
Map
Nearby Homes
- 114 Shallow Creek Ln
- 404 W Boyd Rd
- 406 Poplar St
- 307 Poplar St
- 306 Poplar St
- 308 Poplar St
- 501 Holsteiner Rd
- 800 Marwari Way
- 501 Holsteiner Rd Unit 68
- 503 Holsteiner Rd Unit 67
- 505 Holsteiner Rd Unit 66
- 507 Holsteiner Rd Unit 65
- 506 Holsteiner Rd Unit 64
- 504 Holsteiner Rd Unit 63
- 502 Holsteiner Rd Unit 62
- 713 Lipizzan Trace Unit 102
- 711 Lipizzan Trace Unit 101
- 201 Elm St
- 201 Oak St
- 613 Rifle Ridge
- 3028 Mobley Bridge Rd
- 0 Mountville and Bass Crossroad Unit 191.729 AC 7417094
- 3060 Mobley Bridge Rd
- 3080 Mobley Bridge Rd
- 3094 Mobley Bridge Rd
- 206 Bolee St
- 125 Dusty's Rd
- 125 Dusty's Rd Unit 25
- 11 Woodard St
- 23 Woodard St
- 3096 Mobley Bridge Rd
- 123 Dustys Rd
- 3096-C D Mobley Bridge Rd
- 127 Dustys Rd
- 127 Dustys Rd
- 34 Woodard St
- 129 Dustys Rd
- 114 Lee St
- 3136 Mobley Bridge Rd Unit G H
- 3136 Mobley Bridge Rd Unit E F