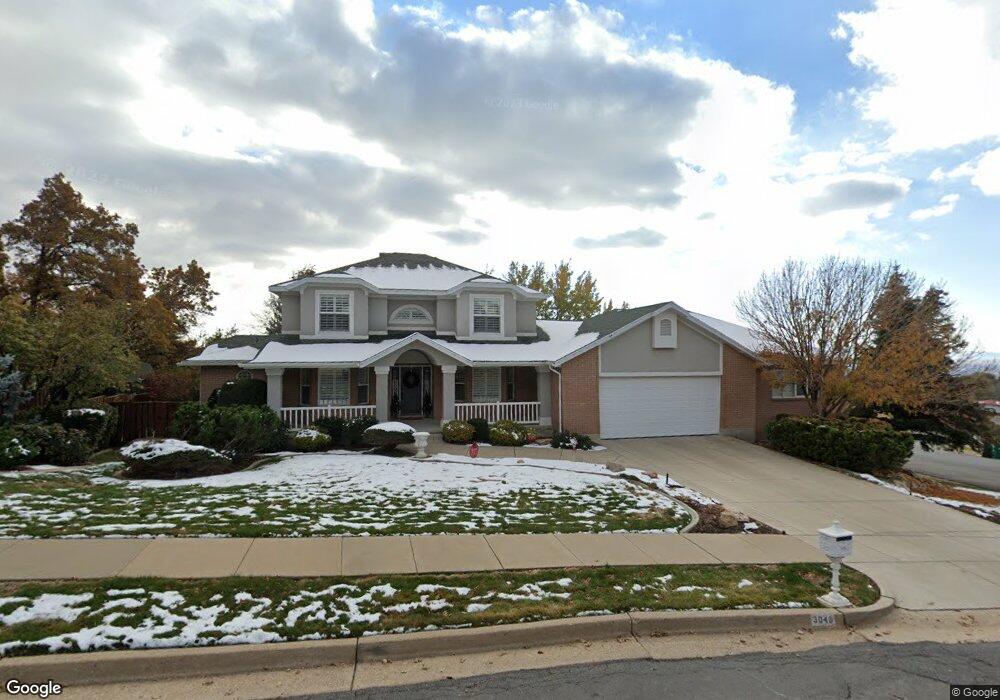
3040 Wind River Dr Layton, UT 84040
Estimated Value: $829,000 - $900,171
4
Beds
3
Baths
3,572
Sq Ft
$243/Sq Ft
Est. Value
About This Home
This home is located at 3040 Wind River Dr, Layton, UT 84040 and is currently estimated at $868,543, approximately $243 per square foot. 3040 Wind River Dr is a home located in Davis County with nearby schools including Morgan Elementary School, Fairfield Junior High School, and Layton High School.
Ownership History
Date
Name
Owned For
Owner Type
Purchase Details
Closed on
Jun 30, 2020
Sold by
Bahl Robert J and Bahl Janis C
Bought by
Phelps Anthony Blake and Phelps Amber Michelle
Current Estimated Value
Home Financials for this Owner
Home Financials are based on the most recent Mortgage that was taken out on this home.
Original Mortgage
$425,000
Outstanding Balance
$376,021
Interest Rate
3.1%
Mortgage Type
New Conventional
Estimated Equity
$492,522
Purchase Details
Closed on
Aug 24, 2016
Sold by
Bahl Janis C and Bahl Robert J
Bought by
Bahl Janis C and Bahl Robert J
Purchase Details
Closed on
Nov 28, 1997
Sold by
Bahl Robert J and Bahl Janis C
Bought by
Bahl Janis C and Bahl Robert J
Purchase Details
Closed on
May 6, 1997
Sold by
Rogich Philip J and Rogich Stephanie R
Bought by
Rogich Philip J and Rogich Stephanie R
Create a Home Valuation Report for This Property
The Home Valuation Report is an in-depth analysis detailing your home's value as well as a comparison with similar homes in the area
Home Values in the Area
Average Home Value in this Area
Purchase History
| Date | Buyer | Sale Price | Title Company |
|---|---|---|---|
| Phelps Anthony Blake | -- | None Available | |
| Bahl Janis C | -- | None Available | |
| Bahl Janis C | -- | -- | |
| Rogich Philip J | -- | Bonneville Title Company Inc |
Source: Public Records
Mortgage History
| Date | Status | Borrower | Loan Amount |
|---|---|---|---|
| Open | Phelps Anthony Blake | $425,000 |
Source: Public Records
Tax History
| Year | Tax Paid | Tax Assessment Tax Assessment Total Assessment is a certain percentage of the fair market value that is determined by local assessors to be the total taxable value of land and additions on the property. | Land | Improvement |
|---|---|---|---|---|
| 2025 | $4,171 | $437,800 | $200,023 | $237,777 |
| 2024 | $3,901 | $412,500 | $209,368 | $203,132 |
| 2023 | $3,890 | $725,000 | $232,586 | $492,414 |
| 2022 | $4,010 | $405,900 | $119,738 | $286,162 |
| 2021 | $3,803 | $574,000 | $168,939 | $405,061 |
| 2020 | $3,632 | $526,000 | $166,019 | $359,981 |
| 2019 | $3,511 | $498,000 | $159,634 | $338,366 |
| 2018 | $3,413 | $486,000 | $147,810 | $338,190 |
| 2016 | $3,179 | $233,530 | $92,614 | $140,916 |
| 2015 | $3,080 | $214,775 | $92,614 | $122,161 |
| 2014 | $3,342 | $238,273 | $92,614 | $145,659 |
| 2013 | -- | $196,185 | $42,603 | $153,582 |
Source: Public Records
Map
Nearby Homes
- 133 Blue Sage Ln
- 1494 Orchard Ridge Ln Unit 315
- 1390 Orchard Ridge Ln
- 1463 Stone House Bend Unit 405
- 1423 Stone House Bend Unit 403
- 1406 Stone House Bend Unit 413
- 2702 E Oak Hills Dr
- 378 N Thurston Ln
- 717 Woodridge Dr
- 1048 N Kensington Heights
- 2603 Summerwood Dr
- 2382 Summerwood Dr
- 815 E Oxford Dr
- 1365 E Oakmont Ln
- 2855 E Gentile St Unit 1
- 1270 E 700 N
- 1370 Oakmont Ln
- 1357 E 650 N
- 660 N 1340 E Unit 8
- 2877 E Gentile St Unit 2
- 33 N 3100 E
- 3028 Corral Dr
- 41 N 3100 E
- 3049 Corral Dr
- 3059 Wind River Dr
- 27 N 3100 E
- 60 Wind River Dr
- 3081 E 25 S
- 3081 E 25 S Unit 12
- 3021 Corral Dr
- 87 Wind River Dr
- 3034 Tanglewood Dr
- 75 Wind River Dr
- 3075 Wind River Dr
- 3059 E 25 S
- 13 N 3100 E
- 110 Wind River Dr Unit 113
- 44 N 3100 E
- 3092 Tanglewood Dr
- 109 Wind River Dr
Your Personal Tour Guide
Ask me questions while you tour the home.