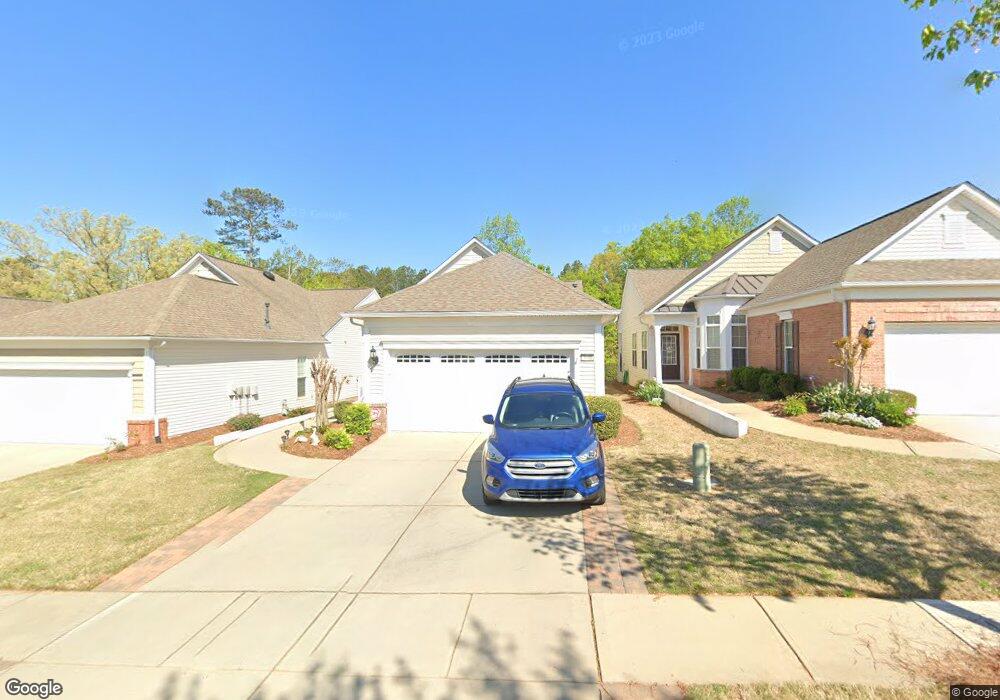
3041 Azalea Dr Fort Mill, SC 29707
Estimated Value: $427,721 - $442,000
2
Beds
2
Baths
1,492
Sq Ft
$291/Sq Ft
Est. Value
About This Home
This home is located at 3041 Azalea Dr, Fort Mill, SC 29707 and is currently estimated at $434,430, approximately $291 per square foot. 3041 Azalea Dr is a home located in Lancaster County with nearby schools including Van Wyck Elementary School, Indian Land Elementary School, and Indian Land Middle School.
Ownership History
Date
Name
Owned For
Owner Type
Purchase Details
Closed on
Mar 5, 2018
Sold by
Richardson Monte and Richardson Denise
Bought by
Fujimoto Fumio Ralph and Fujimoto Fumio R
Current Estimated Value
Home Financials for this Owner
Home Financials are based on the most recent Mortgage that was taken out on this home.
Original Mortgage
$229,230
Outstanding Balance
$195,682
Interest Rate
4.22%
Mortgage Type
VA
Estimated Equity
$238,748
Purchase Details
Closed on
Jul 13, 2012
Sold by
Weier Jean
Bought by
Richardson Monte and Richardson Denise
Purchase Details
Closed on
Oct 6, 2009
Sold by
Bowman Richard T and Bowman Mary Kay
Bought by
Weir Jean
Home Financials for this Owner
Home Financials are based on the most recent Mortgage that was taken out on this home.
Original Mortgage
$149,900
Interest Rate
5.05%
Mortgage Type
New Conventional
Purchase Details
Closed on
Jun 20, 2006
Sold by
Pulte Home Corp
Bought by
Bowman Richard T and Bowman Mary Kay
Create a Home Valuation Report for This Property
The Home Valuation Report is an in-depth analysis detailing your home's value as well as a comparison with similar homes in the area
Home Values in the Area
Average Home Value in this Area
Purchase History
| Date | Buyer | Sale Price | Title Company |
|---|---|---|---|
| Fujimoto Fumio Ralph | $283,000 | None Available | |
| Richardson Monte | $223,000 | -- | |
| Weir Jean | $224,900 | -- | |
| Bowman Richard T | $212,445 | None Available |
Source: Public Records
Mortgage History
| Date | Status | Borrower | Loan Amount |
|---|---|---|---|
| Open | Fujimoto Fumio Ralph | $229,230 | |
| Previous Owner | Weir Jean | $149,900 |
Source: Public Records
Tax History Compared to Growth
Tax History
| Year | Tax Paid | Tax Assessment Tax Assessment Total Assessment is a certain percentage of the fair market value that is determined by local assessors to be the total taxable value of land and additions on the property. | Land | Improvement |
|---|---|---|---|---|
| 2024 | $2,068 | $11,568 | $2,800 | $8,768 |
| 2023 | $1,977 | $11,568 | $2,800 | $8,768 |
| 2022 | $1,918 | $11,568 | $2,800 | $8,768 |
| 2021 | $1,887 | $11,568 | $2,800 | $8,768 |
| 2020 | $1,823 | $10,900 | $3,000 | $7,900 |
| 2019 | $3,686 | $10,900 | $3,000 | $7,900 |
| 2018 | $3,007 | $9,240 | $3,000 | $6,240 |
| 2017 | $1,544 | $0 | $0 | $0 |
| 2016 | $1,780 | $0 | $0 | $0 |
| 2015 | $1,534 | $0 | $0 | $0 |
| 2014 | $1,534 | $0 | $0 | $0 |
| 2013 | $1,534 | $0 | $0 | $0 |
Source: Public Records
Map
Nearby Homes
- 3040 Azalea Dr
- 5018 Grandview Dr
- 3079 Azalea Dr
- 172 Sweet Briar Dr
- 825 Spelman Dr
- 225 Yale Place
- 3486 Duchess Ave
- 7406 Carolina Jessamine Ct
- 188 Sweet Briar Dr
- 200 Sweet Briar Dr
- 2005 White Cedar Ln
- 911 Lily Magnolia Ct
- 1045 Princeton Dr
- 33129 Tanager Ct
- 270 Sweet Briar Dr
- 33124 Tanager Ct
- 33128 Tanager Ct
- 28129 Song Sparrow Ln Unit 14
- 28112 Song Sparrow Ln
- 26444 Sandpiper Ct
- 3041 Azalea Dr Unit 52
- 3041 Azalea Dr
- 3043 Azalea Dr
- 3039 Azalea Dr
- 3039 Azalea Dr
- 3037 Azalea Dr
- 3037 Azalea Dr
- 3045 Azalea Dr
- 3045 Azalea Dr
- 3035 Azalea Dr
- 3035 Azalea Dr
- 3047 Azalea Dr
- 3033 Azalea Dr
- 3049 Azalea Dr
- 3049 Azalea Dr
- 3040 Azalea Dr
- 3040 Azalea Dr Unit 97
- 3042 Azalea Dr
- 3036 Azalea Dr
- 3044 Azalea Dr