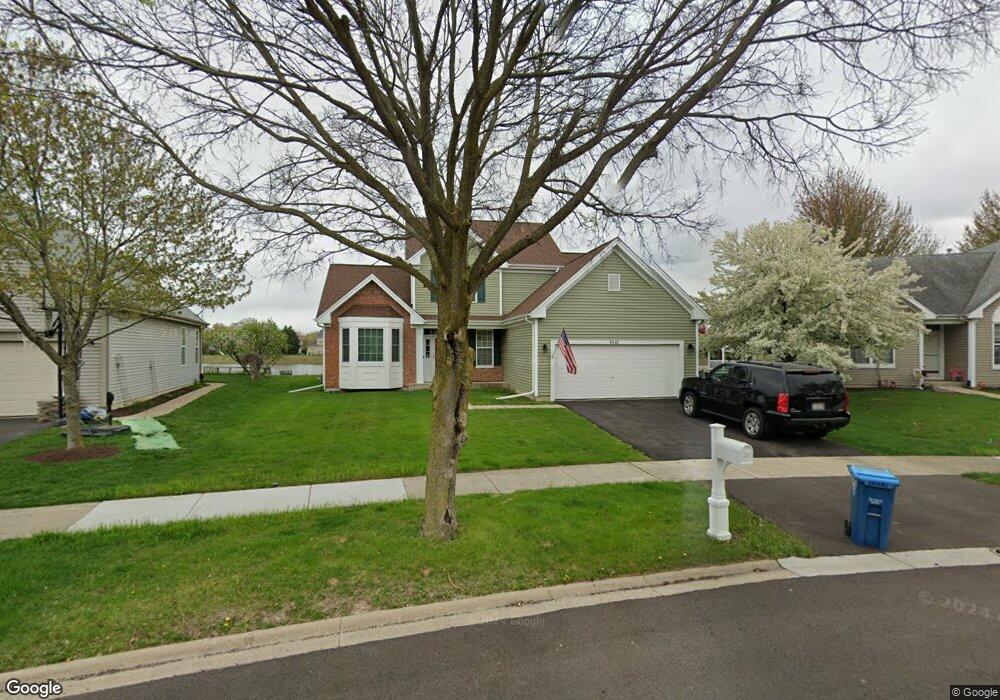
3041 Solitude Ln Aurora, IL 60502
Big Woods Marmion NeighborhoodEstimated Value: $395,813 - $461,000
--
Bed
--
Bath
2,106
Sq Ft
$203/Sq Ft
Est. Value
About This Home
This home is located at 3041 Solitude Ln, Aurora, IL 60502 and is currently estimated at $427,953, approximately $203 per square foot. 3041 Solitude Ln is a home located in Kane County with nearby schools including Louise White Elementary School, Sam Rotolo Middle School, and Batavia Sr High School.
Ownership History
Date
Name
Owned For
Owner Type
Purchase Details
Closed on
Mar 11, 2025
Sold by
Obordo Alexander S
Bought by
Alexander S Obordo And Catherine D Obordo Liv and Obordo
Current Estimated Value
Purchase Details
Closed on
Sep 13, 2018
Sold by
Obordo Cornelio S J and Cornelio S J Obordo Living Tru
Bought by
Obordo Alexander S J
Purchase Details
Closed on
Feb 3, 2000
Sold by
Obordo Cornelio S J
Bought by
Obordo Cornelio S J and Cornelio S J Obordo Living Trust
Purchase Details
Closed on
Dec 3, 1999
Sold by
Obordo Alexander S J and Obordo Tina Marie
Bought by
Obordo Cornelio S J
Purchase Details
Closed on
Oct 25, 1996
Sold by
Wiseman Hughes Enterprises Inc
Bought by
Obordo Alexander S and Obordo Tina Marie
Home Financials for this Owner
Home Financials are based on the most recent Mortgage that was taken out on this home.
Original Mortgage
$158,500
Interest Rate
8.23%
Create a Home Valuation Report for This Property
The Home Valuation Report is an in-depth analysis detailing your home's value as well as a comparison with similar homes in the area
Home Values in the Area
Average Home Value in this Area
Purchase History
| Date | Buyer | Sale Price | Title Company |
|---|---|---|---|
| Alexander S Obordo And Catherine D Obordo Liv | -- | None Listed On Document | |
| Obordo Alexander S J | -- | None Available | |
| Obordo Cornelio S J | -- | -- | |
| Obordo Cornelio S J | -- | -- | |
| Obordo Alexander S | $158,000 | Chicago Title Insurance Co |
Source: Public Records
Mortgage History
| Date | Status | Borrower | Loan Amount |
|---|---|---|---|
| Previous Owner | Obordo Alexander S | $158,500 |
Source: Public Records
Tax History Compared to Growth
Tax History
| Year | Tax Paid | Tax Assessment Tax Assessment Total Assessment is a certain percentage of the fair market value that is determined by local assessors to be the total taxable value of land and additions on the property. | Land | Improvement |
|---|---|---|---|---|
| 2024 | -- | $120,785 | $20,814 | $99,971 |
| 2023 | -- | $109,625 | $18,891 | $90,734 |
| 2022 | $8,995 | $102,453 | $17,655 | $84,798 |
| 2021 | $8,995 | $97,167 | $16,744 | $80,423 |
| 2020 | $8,455 | $95,299 | $16,422 | $78,877 |
| 2019 | $8,708 | $91,926 | $15,841 | $76,085 |
| 2018 | $8,332 | $88,425 | $15,238 | $73,187 |
| 2017 | $8,172 | $85,510 | $14,736 | $70,774 |
| 2016 | $8,056 | $83,020 | $14,307 | $68,713 |
| 2015 | -- | $81,129 | $13,981 | $67,148 |
| 2014 | -- | $78,575 | $13,541 | $65,034 |
| 2013 | -- | $78,517 | $14,752 | $63,765 |
Source: Public Records
Map
Nearby Homes
- 2979 Arbor Ln
- 1639 Bentz Way
- 1580 Wind Energy Pass
- 2271 Scott Ln Unit 5324
- 2025 Gillenwater St
- 3S201 S Raddant Rd
- 3003 Abbey Cir
- 3075 Mesa Ln
- 3001 Abbey Cir
- 2315 Nan St
- 2673 Wydown Ln
- 733 Wind Energy Pass
- 1332 Giese Rd Unit 2
- 1155 Hanover Dr
- 1342 Chillem Dr
- 1953 Charles Ln Unit 1953
- 1942 Tall Oaks Dr Unit 1A
- 1826 N Farnsworth Ave
- 616 Pinehurst Dr
- 473 Bond Dr
- 3049 Solitude Ln
- 3033 Solitude Ln
- 3057 Solitude Ln
- 3025 Solitude Ln
- 3028 Solitude Ln
- 3065 Solitude Ln
- 3052 Solitude Ln
- 3017 Solitude Ln
- 3060 Solitude Ln
- 3012 Solitude Ln
- 3073 Solitude Ln
- 3009 Solitude Ln
- 1643 Horizon Ln
- 3043 Sawgrass Dr
- 3001 Solitude Ln
- 3019 Sawgrass Dr Unit 1
- 1633 Horizon Ln
- 3081 Solitude Ln
- 3055 Sawgrass Dr
- 3080 Solitude Ln