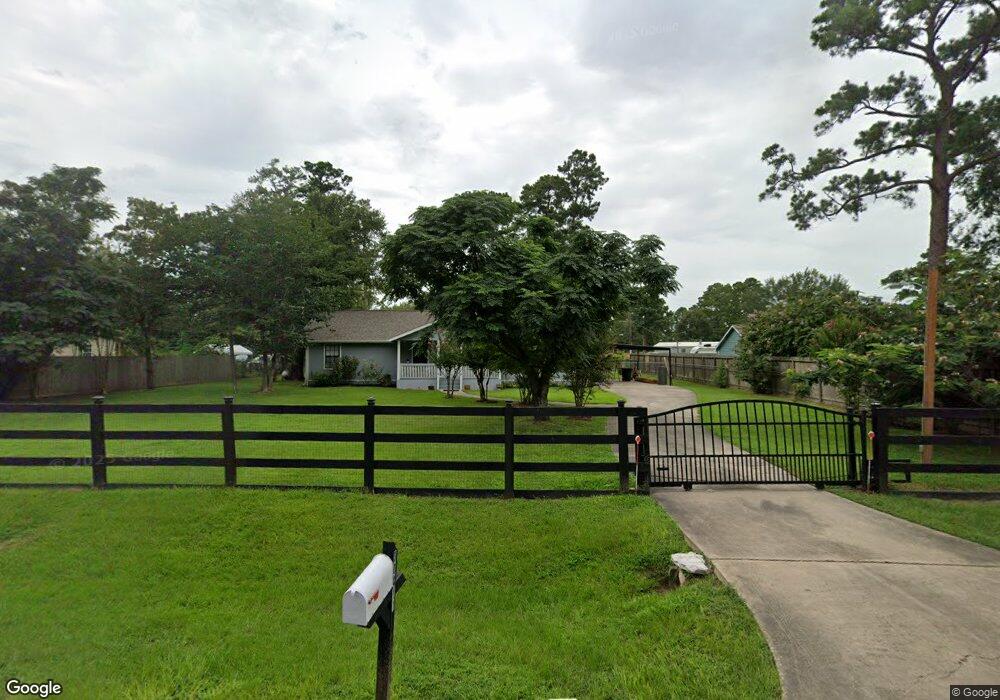
30411 Davis St Magnolia, TX 77355
Estimated Value: $269,787 - $410,000
3
Beds
2
Baths
2,176
Sq Ft
$163/Sq Ft
Est. Value
About This Home
This home is located at 30411 Davis St, Magnolia, TX 77355 and is currently estimated at $354,197, approximately $162 per square foot. 30411 Davis St is a home located in Montgomery County with nearby schools including Magnolia Elementary School, Magnolia Sixth Grade Campus, and Magnolia Junior High School.
Ownership History
Date
Name
Owned For
Owner Type
Purchase Details
Closed on
Mar 18, 2013
Sold by
Conner Bobby J and Conner Patsy
Bought by
Cruz Jose M
Current Estimated Value
Home Financials for this Owner
Home Financials are based on the most recent Mortgage that was taken out on this home.
Original Mortgage
$67,450
Outstanding Balance
$47,705
Interest Rate
3.59%
Mortgage Type
New Conventional
Estimated Equity
$306,492
Purchase Details
Closed on
May 28, 2009
Sold by
Washington Helen
Bought by
Conner Bobby J and Conner Patsy
Home Financials for this Owner
Home Financials are based on the most recent Mortgage that was taken out on this home.
Original Mortgage
$76,500
Interest Rate
4.76%
Mortgage Type
Purchase Money Mortgage
Purchase Details
Closed on
Nov 7, 2000
Sold by
Rickett R C and Rickett Mildred H
Bought by
Conner Bobby Jack and Conner Patsy
Purchase Details
Closed on
Sep 1, 1982
Sold by
Hunters Retreat
Bought by
Cruz Jose M
Create a Home Valuation Report for This Property
The Home Valuation Report is an in-depth analysis detailing your home's value as well as a comparison with similar homes in the area
Home Values in the Area
Average Home Value in this Area
Purchase History
| Date | Buyer | Sale Price | Title Company |
|---|---|---|---|
| Cruz Jose M | -- | -- | |
| Conner Bobby J | -- | Stewart Title Houston Div | |
| Conner Bobby Jack | -- | -- | |
| Cruz Jose M | -- | -- |
Source: Public Records
Mortgage History
| Date | Status | Borrower | Loan Amount |
|---|---|---|---|
| Open | Cruz Jose M | $67,450 | |
| Previous Owner | Conner Bobby J | $76,500 |
Source: Public Records
Tax History Compared to Growth
Tax History
| Year | Tax Paid | Tax Assessment Tax Assessment Total Assessment is a certain percentage of the fair market value that is determined by local assessors to be the total taxable value of land and additions on the property. | Land | Improvement |
|---|---|---|---|---|
| 2025 | $1,710 | $197,235 | -- | -- |
| 2024 | $1,710 | $179,305 | $52,728 | $126,577 |
| 2023 | $1,476 | $164,150 | $52,730 | $133,970 |
| 2022 | $2,633 | $149,230 | $52,730 | $133,970 |
| 2021 | $2,522 | $135,660 | $17,240 | $130,110 |
| 2020 | $2,496 | $123,330 | $17,240 | $137,030 |
| 2019 | $2,258 | $112,120 | $17,240 | $139,920 |
| 2018 | $1,697 | $101,930 | $17,240 | $139,950 |
| 2017 | $1,965 | $92,660 | $7,130 | $178,910 |
| 2016 | $1,786 | $84,240 | $7,130 | $130,900 |
| 2015 | $1,279 | $76,580 | $7,130 | $137,130 |
| 2014 | $1,279 | $69,620 | $7,130 | $62,490 |
Source: Public Records
Map
Nearby Homes
- 37121 Fm 1774
- 29927 Hunters
- 29923 Hunters
- 30519 Lake Circle Ln
- 37111 Middle Trail Unit 1
- 30512 Lake Circle Ln
- 30619 Hazy Meadow Dr
- 30714 Meadow Wood Lot 64 Dr
- 18735 Creek Falls Ln
- 30727 Lake Edge Ln
- 30731 N Cripple Creek Dr
- 504 High Meadow Ranch Dr
- 30814 N Cripple Creek Dr
- 30910 Misty Meadow Dr
- 30926 Hilltop Ln
- 624 High Meadow Ranch Dr
- 37402 Robin George Trail
- 28812 Village Bend
- 31002 Misty Meadow Dr
- TBD N Cripple Creek Dr
- 30419 Davis St
- 30403 Davis St
- 30319 Davis St
- 30418 Davis St
- 37102 Arlene St
- 37026 Arlene St
- 37110 Arlene St
- 30311 Davis St
- 30319 Scotty St
- 30310 Scotty St
- 30311 Rickett Rd
- 37118 Arlene St
- 37129 Farm To Market 1774
- 30303 Scotty St
- 30402 Rickett Rd
- 30218 Scotty St
- 37110 Tadpole Trail
- 30210 Davis St
- 30207 Hunters Rd
- 30211 Hunters Rd