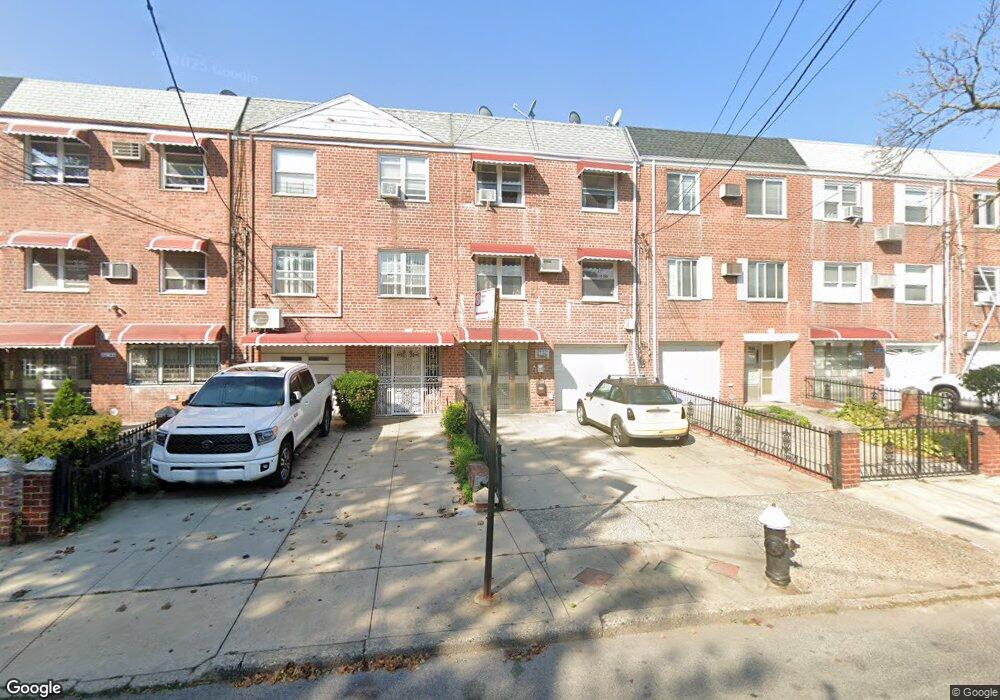
3042 74th St East Elmhurst, NY 11370
Jackson Heights NeighborhoodEstimated Value: $1,090,914 - $1,385,000
--
Bed
--
Bath
2,422
Sq Ft
$494/Sq Ft
Est. Value
About This Home
This home is located at 3042 74th St, East Elmhurst, NY 11370 and is currently estimated at $1,196,979, approximately $494 per square foot. 3042 74th St is a home located in Queens County with nearby schools including Ps 152 Gwendolyn N Alleyne School, I.S. 230, and William Cullen Bryant High School.
Ownership History
Date
Name
Owned For
Owner Type
Purchase Details
Closed on
Oct 4, 2023
Sold by
Kanagaki Dr. Ronald and Kanagaki June
Bought by
Daryan Home Llc
Current Estimated Value
Purchase Details
Closed on
Oct 31, 2003
Sold by
Kanagaki Betty S and Kanagaki Dr Ronald
Bought by
Kanagaki Dr Ronald and Kanagaki June
Purchase Details
Closed on
Dec 28, 1998
Sold by
Kanagaki Betty S and Fujisaki Tom W
Bought by
Kanagaki Dr Ronald
Create a Home Valuation Report for This Property
The Home Valuation Report is an in-depth analysis detailing your home's value as well as a comparison with similar homes in the area
Home Values in the Area
Average Home Value in this Area
Purchase History
| Date | Buyer | Sale Price | Title Company |
|---|---|---|---|
| Daryan Home Llc | $720,000 | -- | |
| Daryan Home Llc | $720,000 | -- | |
| Kanagaki Dr Ronald | -- | -- | |
| Kanagaki Dr Ronald | -- | -- | |
| Kanagaki Dr Ronald | -- | Regal Title | |
| Kanagaki Dr Ronald | -- | Regal Title |
Source: Public Records
Tax History Compared to Growth
Tax History
| Year | Tax Paid | Tax Assessment Tax Assessment Total Assessment is a certain percentage of the fair market value that is determined by local assessors to be the total taxable value of land and additions on the property. | Land | Improvement |
|---|---|---|---|---|
| 2025 | $10,715 | $56,548 | $7,625 | $48,923 |
| 2024 | $10,715 | $53,347 | $8,483 | $44,864 |
| 2023 | $10,595 | $52,751 | $7,542 | $45,209 |
| 2022 | $9,993 | $62,460 | $10,380 | $52,080 |
| 2021 | $10,512 | $61,800 | $10,380 | $51,420 |
| 2020 | $9,975 | $65,880 | $10,380 | $55,500 |
| 2019 | $9,300 | $64,620 | $10,380 | $54,240 |
| 2018 | $8,961 | $43,959 | $8,014 | $35,945 |
| 2017 | $8,961 | $43,959 | $9,118 | $34,841 |
| 2016 | $8,321 | $43,959 | $9,118 | $34,841 |
| 2015 | $5,002 | $39,269 | $9,999 | $29,270 |
| 2014 | $5,002 | $37,047 | $9,730 | $27,317 |
Source: Public Records
Map
Nearby Homes