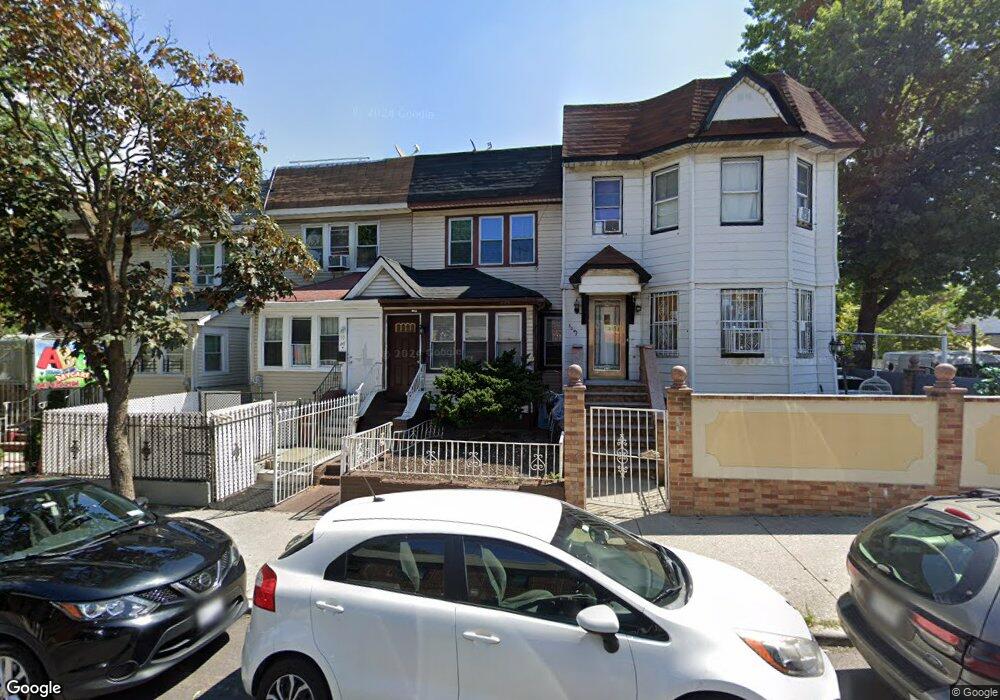
3043 92nd St East Elmhurst, NY 11369
Jackson Heights NeighborhoodEstimated Value: $841,825 - $924,000
--
Bed
--
Bath
1,320
Sq Ft
$664/Sq Ft
Est. Value
About This Home
This home is located at 3043 92nd St, East Elmhurst, NY 11369 and is currently estimated at $876,956, approximately $664 per square foot. 3043 92nd St is a home located in Queens County with nearby schools including P.S. 149 Christa Mcauliffe, I.S. 145 Joseph Pulitzer Magnet School, and Newtown High School.
Ownership History
Date
Name
Owned For
Owner Type
Purchase Details
Closed on
Dec 22, 2017
Sold by
Jimenez Uriel and Jiminez Uriel
Bought by
Akter Asia
Current Estimated Value
Home Financials for this Owner
Home Financials are based on the most recent Mortgage that was taken out on this home.
Original Mortgage
$412,750
Outstanding Balance
$347,499
Interest Rate
3.94%
Mortgage Type
Purchase Money Mortgage
Estimated Equity
$529,457
Purchase Details
Closed on
Nov 23, 1998
Sold by
Cola Nicholas
Bought by
Jimenez Uriel and Cardeno Amanda
Home Financials for this Owner
Home Financials are based on the most recent Mortgage that was taken out on this home.
Original Mortgage
$162,000
Interest Rate
6.89%
Purchase Details
Closed on
Jun 16, 1998
Sold by
Deutschen Andrew Raymond and Deutschen Andrew
Bought by
Cola Nicholas
Home Financials for this Owner
Home Financials are based on the most recent Mortgage that was taken out on this home.
Original Mortgage
$82,500
Interest Rate
6.92%
Create a Home Valuation Report for This Property
The Home Valuation Report is an in-depth analysis detailing your home's value as well as a comparison with similar homes in the area
Home Values in the Area
Average Home Value in this Area
Purchase History
| Date | Buyer | Sale Price | Title Company |
|---|---|---|---|
| Akter Asia | $662,000 | -- | |
| Jimenez Uriel | $180,000 | United General Title Ins Co | |
| Cola Nicholas | $110,000 | Uslife Title Insurance Compa |
Source: Public Records
Mortgage History
| Date | Status | Borrower | Loan Amount |
|---|---|---|---|
| Open | Akter Asia | $412,750 | |
| Previous Owner | Jimenez Uriel | $162,000 | |
| Previous Owner | Cola Nicholas | $82,500 |
Source: Public Records
Tax History Compared to Growth
Tax History
| Year | Tax Paid | Tax Assessment Tax Assessment Total Assessment is a certain percentage of the fair market value that is determined by local assessors to be the total taxable value of land and additions on the property. | Land | Improvement |
|---|---|---|---|---|
| 2025 | $6,102 | $32,204 | $6,953 | $25,251 |
| 2024 | $6,102 | $30,382 | $7,030 | $23,352 |
| 2023 | $5,757 | $28,663 | $5,905 | $22,758 |
| 2022 | $5,493 | $46,260 | $10,260 | $36,000 |
| 2021 | $5,791 | $46,980 | $10,260 | $36,720 |
| 2020 | $5,681 | $41,220 | $10,260 | $30,960 |
| 2019 | $5,296 | $39,660 | $10,260 | $29,400 |
| 2018 | $4,869 | $23,886 | $6,807 | $17,079 |
| 2017 | $3,302 | $22,929 | $8,468 | $14,461 |
| 2016 | $4,274 | $22,929 | $8,468 | $14,461 |
| 2015 | $2,389 | $22,364 | $8,964 | $13,400 |
| 2014 | $2,389 | $21,099 | $9,499 | $11,600 |
Source: Public Records
Map
Nearby Homes
- 30-33 92nd St
- 30-36 91st St
- 31-05 90th St
- 91-10 32nd Ave Unit 303
- 91-10 32nd Ave Unit E102
- 31-46 94th St
- 91-8 32nd Ave Unit E107
- 31-14 90th St
- 31-10 95th St
- 26-44 92nd St
- 32-22 92nd St Unit 603
- 32-22 92nd St Unit 502
- 90-10 32nd Ave Unit 602
- 90-08 32nd Ave Unit 108
- 32-25 91st St Unit C508
- 32-25 91st St Unit 209
- 32-20 92nd St Unit D507
- 94-11 32nd Ave
- 32-22 91st St Unit 106
- 32-22 91st St Unit 406