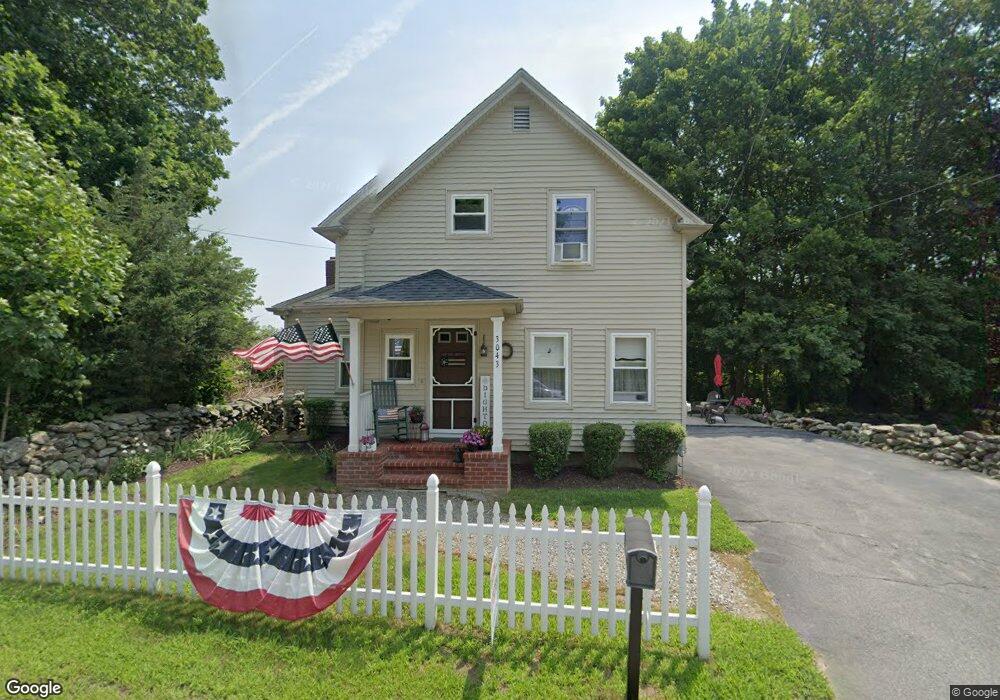
3043 Elm St Dighton, MA 02715
Estimated Value: $303,000 - $585,000
3
Beds
1
Bath
989
Sq Ft
$411/Sq Ft
Est. Value
About This Home
This home is located at 3043 Elm St, Dighton, MA 02715 and is currently estimated at $406,566, approximately $411 per square foot. 3043 Elm St is a home located in Bristol County with nearby schools including Dighton-Rehoboth Regional High School.
Ownership History
Date
Name
Owned For
Owner Type
Purchase Details
Closed on
Aug 13, 1999
Sold by
Shannon Richard B and Shannon Deborah F
Bought by
Salve Ii Richard A and Salve Gayle M
Current Estimated Value
Home Financials for this Owner
Home Financials are based on the most recent Mortgage that was taken out on this home.
Original Mortgage
$118,830
Interest Rate
7.65%
Mortgage Type
VA
Purchase Details
Closed on
Jan 29, 1999
Sold by
Fhlmc
Bought by
Shannon Richard B and Shannon Deborah F
Home Financials for this Owner
Home Financials are based on the most recent Mortgage that was taken out on this home.
Original Mortgage
$68,000
Interest Rate
6.67%
Mortgage Type
Purchase Money Mortgage
Purchase Details
Closed on
May 14, 1998
Sold by
Mello Linda K and First Bankers Mtg Corp
Bought by
Fhlmc
Purchase Details
Closed on
Feb 1, 1995
Sold by
Fhlmc
Bought by
Mello Linda K
Purchase Details
Closed on
Dec 23, 1994
Sold by
Mcguinness Timothy M and Mcguinness Fhlmc
Bought by
Fhlmc
Create a Home Valuation Report for This Property
The Home Valuation Report is an in-depth analysis detailing your home's value as well as a comparison with similar homes in the area
Home Values in the Area
Average Home Value in this Area
Purchase History
| Date | Buyer | Sale Price | Title Company |
|---|---|---|---|
| Salve Ii Richard A | $116,500 | -- | |
| Shannon Richard B | $35,000 | -- | |
| Fhlmc | $66,300 | -- | |
| Mello Linda K | $79,500 | -- | |
| Fhlmc | $59,500 | -- |
Source: Public Records
Mortgage History
| Date | Status | Borrower | Loan Amount |
|---|---|---|---|
| Open | Fhlmc | $160,532 | |
| Closed | Fhlmc | $118,830 | |
| Previous Owner | Fhlmc | $68,000 |
Source: Public Records
Tax History Compared to Growth
Tax History
| Year | Tax Paid | Tax Assessment Tax Assessment Total Assessment is a certain percentage of the fair market value that is determined by local assessors to be the total taxable value of land and additions on the property. | Land | Improvement |
|---|---|---|---|---|
| 2025 | $3,291 | $262,000 | $91,600 | $170,400 |
| 2024 | $3,286 | $240,200 | $91,600 | $148,600 |
| 2023 | $3,130 | $224,500 | $91,600 | $132,900 |
| 2022 | $3,015 | $211,000 | $89,400 | $121,600 |
| 2021 | $3,647 | $192,100 | $80,600 | $111,500 |
| 2020 | $2,821 | $188,300 | $90,900 | $97,400 |
| 2019 | $2,655 | $177,100 | $90,900 | $86,200 |
| 2018 | $53 | $162,600 | $77,000 | $85,600 |
| 2017 | $3,160 | $160,000 | $89,700 | $70,300 |
| 2016 | $2,425 | $159,200 | $92,400 | $66,800 |
| 2015 | $2,316 | $156,500 | $95,100 | $61,400 |
| 2014 | $2,329 | $152,900 | $95,100 | $57,800 |
Source: Public Records
Map
Nearby Homes
- 3076 County St
- 259 Lynch Ave
- 631 Hart St
- 107 Manchester Ave
- 3057 Clubhouse Dr
- 3055 Clubhouse Dr Unit 80
- 3051 Clubhouse Dr Unit 78
- 3049 Clubhouse Dr Unit 77
- 3035 Clubhouse Dr
- 3035 Clubhouse Dr Unit 8
- 3035 Clubhouse Dr Unit 7
- 3035 Clubhouse Dr Unit 6
- 3035 Clubhouse Dr Unit 5
- 3035 Clubhouse Dr Unit 4
- 3035 Clubhouse Dr Unit 3
- 3035 Clubhouse Dr Unit 2
- 3035 Clubhouse Dr Unit 1
- 3064 Clubhouse Dr
- 435 Fairway Dr
- 3075 Club House Dr